Boeing,
Q1 2019 - Results
April, 24 2019
1. PREVIOUS ANALYSES
Before diving in the Q1 results, I’ll start by reading my previous analysis.
2. RESULTS
3. POSITIVES
3.1. Strong backlog
One of the best things Boeing has is its strong backlog. The fear was that after the two 737-Max crashes, the airlines would just withdraw their orders and turn to Airbus instead. This doesn’t seem to be the case. Although the backlog has decreased by $3B, it remains as strong as ever.

3.2. Embraer
In the first quarter the partnership with Embraer was finally confirmed, which means an even larger moat and added capacity.

3.3. Strong Defense, Space and Security performance
Although this is the third largest division by operating profit, it’s also the second largest by revenue. Its revenue went up by 2% and the earnings from operations by 12%. This was due to higher volume of satellites, weapons and surveillance.

3.4. Global Services revenue growth
The revenue for “Global Services”, the fastest growing division and the one with the highest margins has grown by 12%, while its operating margin has decreased from 16,4% a year ago to 14,1% this quarter.

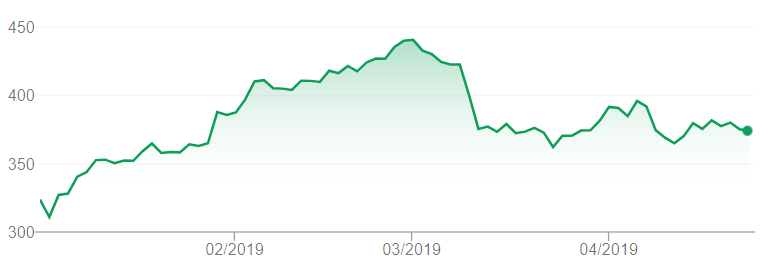
3.5. Share price is down
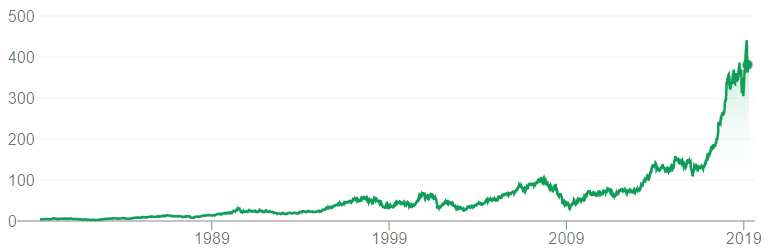
When I first looked at Boeing, its share was trading at $403 but with the recent scandal involving the 787 Max, it came down to $374. Although I count this as a positive, I would like to see a steeper fall….
…because if we look at the long term chart, this correction is just a blip.
4. NEGATIVES
4.1. 737 Max Crashes
This is the most negative news from Q1 and a said episode that killed hundreds of lives. And as if this wasn’t enough, Dennis Muilenburg, the CEO, took too long to come out and speak about it. These two crashes are obviously hindering the company’s performance regarding not only the delivery of the already built airplanes but the future production levels as well…
4.2. Output reduction
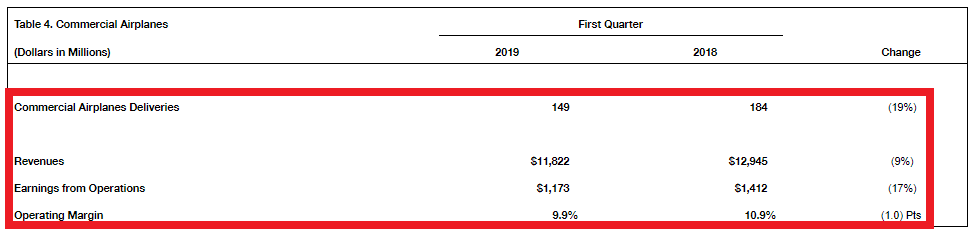
…Unfortunately, due to the two 737-Max crashes, all of the airplanes from this model were grounded around the world which lead to a decline in deliveries from 184 in Q1 2018 to 149 last quarter…
…which in turn lead to a pile up of airplanes on the company’s factories. On the image below we can see three 737-Max parked at the Boeing factory in Renton back in March.
4.3. Revenue is down
Although there isn’t a big seasonality to Boeing’s revenue, the first quarter is usually the weakest one. This year the company as seen a decline of 2% mostly due to the grounding of the 787-Max given that the bulk of revenue is recognized when the airplanes are delivered.

4.4. Pause on the share buyback
The company is hitting the pause button on its share buyback program due to the extraordinary spending on the safety issues.
4.5. Slight balance sheet deterioration
Unfortunately the cash is down by almost $1B and the total debt is up by almost $1B. I would’ve preferred the company to pay down debt instead of paying dividends but I guess cutting down on the dividends would seem a very harsh measure.

But although there is less cash in the bank and a larger debt burden, the net debt is around $8B which is still less than 1x EBITDA.
5. OVERVIEW & CONCLUSION
5.1. OVERVIEW
The story remains unchanged. Boeing is still part of a global duopoly with high barriers to entry with one of the world’s largest backlogs. Of course this two 737-Max crashes have raised a lot of doubts about the safety of the model and the competence of the FAA but this is a short term issue.
Boeing is already working on a software fix for the 737-MAX and although this year’s financial performance will obviously be hurt, a couple of years from now all of this will be water under the bridge.
On my first analysis I’ve estimated a 5% top-line growth for Boeing (in line with global air travel passenger growth) and I am still confident this will be the case in the long run. So in 2028 we could be seeing a market cap of about $685B (including the cash generated over the years) which would represent a 12% CAGR.
5.2. CONCLUSION
This section will be available to paying subscribers in 2019 when we launch the Portfolios.
Don’t forget to check our other analyses.
If you want more, join us at our new:
6. DISCLAIMER
The material contained on this web-page is intended for informational purposes only and is neither an offer nor a recommendation to buy or sell any security. We disclaim any liability for loss, damage, cost or other expense which you might incur as a result of any information provided on this website. Always consult with a registered investment advisor or licensed stockbroker before investing. Please read All in Stock full Disclaimer.