EZCorp,
Q3 2019 - Results
August 02, 2019
1. CONTEXT
EZCorp’s results came out on wednesday. Before checking how the business is doing, I’ll take a quick look at my previous analyses.
Alright, I’ve been quite positive about EZCORP. Although there are things not to like here, in general terms, I like this business.
I definitely have to take a good look at the industry leader “First Cash Financial Services” as it is already a 148 bagger. Yes, you’ve heard me right. If you had invested in FCFS back in 2000, you would’ve multiplied your investment by 148x. That’s a 30% CAGR over 19 years. The thing is, would you be able to hold on to it when the share price plunged by 50% in 2009?
2. RESULTS
Here is both the Press Release and the Presentation.
3. POSITIVES
3.1. Pawn-Loans-Outstanding
Remember, the Pawn-Loans-Outstanding is “the cash the company has lended to its customers and it’s one of the most important metrics because the more cash they lend, the more Pawn-Service-Charges they get”.
The total Pawn-Loans-Outstanding were up by 3,5%.

3.2. Revenue was up
Which lead to a 9% growth in the Pawn-Service-Charges.
Merchandise sales decreased slightly (mostly due to the calculation of certain transaction tax liabilities of prior periods).
Total Revenue grew by 1,4%.

But the net revenue, which is more or less equivalent to the gross profit, went up by…well, almost nothing.

3.3. Same-Store-Loans were up
On the third quarter, Same-Store-Loan growth was up by 3%. 2% in the US and 3% in latin america.
3.4. Adjusted EBITDA went up
And while the revenue went up by 1.4%, the EBITDA went up by 18%…

3.5. Adjusted earnings were up
…which in turn led to a growth of 13% in the adjusted EPS.
The company reports adjusted earnings to compare apples to apples…

…but I’ve got to be honest. There are so many adjustments to the EBITDA and the EPS that I increasingly think I shouldn’t be taking them into account.
3.6. Cash Flows
At least, for the first nine months of the fiscal year, FCF was $40,5M compared to $35.3M a year ago, so we’re on the right track here.

3.7. Repayment of the convertibles
As expected, the company retired $195M of convertible notes in June, which represented 3,2M of total interest expense.

3.8. Net debt is down
The net debt is $179M and the leverage ratio came down to 1,7x from the 2,5x a year ago.
3.8. Acquisitions
Although the acquisition of stores is neither good nor bad in and of itself, I chose to include it here. The company has bought 7 stores in the state of Nevada for $7 Million. This further reinforces the Sum-of-the-parts (SOTP) valuation that I did on my first write-up.
The management team says that there aren’t a lot of assets of size up for sale in the US given that the average operator has 5 to 7 stores and in Mexico it seems that the prices of existing stores are coming down a bit.
The company now has 514 stores in the US and 470 in LATAM.
4. NEGATIVES
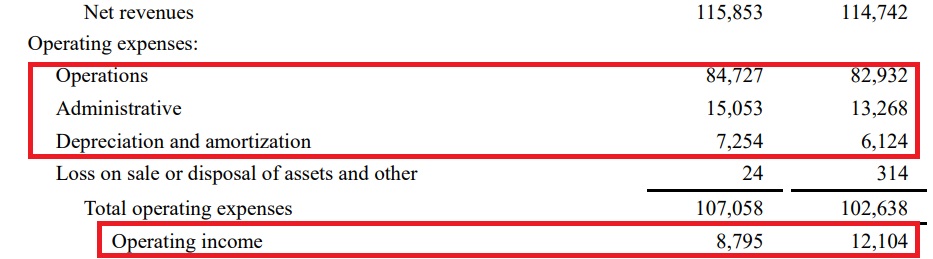
4.1. Operating expenses were up
Depending on if we chose to look at the adjusted numbers or the reported ones, we get to different outcomes. The reported total operating expenses went up by 4%, enough to make the operating income go down by (27%).
4.2. Interest expense was up
And the net interest expense was up $1,2M from the second quarter.

…due to the new debt issued in May.

4.3. Canadian stores are still not profitable
The EBITDA coming from the Canadian stores was still ($300K) although the company highlights that the decrease of ($100K) year-over-year was a lot less than the ($900K) year-over-year decline they saw on Q2.
4.4. Merchandise sales margins went down
The merchandise margins were affected by the sale of older merchandise too.

5. OVERVIEW & CONCLUSION
5.1. OVERVIEW
Overall I think these are average results. I like that the Pawn-Loans-Outstanding went up, the Pawn-Service-Charges went up but there are still a lot of one-time charges that mess up the results.
Having said that, it seems that the management team is following on their plan. Before the full year results come out, I’ll be analysing “First Cash Financial Services” to get a better feeling for the industry.
5.2. CONCLUSION
This section will be available to paying subscribers in 2019 when we launch the Portfolios.
Don’t forget to check our other analyses.
If you want more, join us at our new:
6. DISCLAIMER
The material contained on this web-page is intended for informational purposes only and is neither an offer nor a recommendation to buy or sell any security. We disclaim any liability for loss, damage, cost or other expense which you might incur as a result of any information provided on this website. Always consult with a registered investment advisor or licensed stockbroker before investing. Please read All in Stock full Disclaimer.