Footlocker,
a fundamental analysis!
March 06, 2019
SHARE PRICE: $62.78
MARKET CAP: $7.09B
1. INTRODUCTION
The other day I went out to buy a new pair of sneakers at the nearest Foot Locker store. After a few moments inside the store, all I wanted was to get out of there as fast as I could.
The music was SO LOUD that I asked an employee how could he take it hour after hour, day after day. The guy just shrug his shoulders like “Hey man, I just work here. I don’t have the power to lower the volume”. For the wrong reasons, this episode sparked my interest about this company. As always, I’m starting by taking a look at their website.
2. BUSINESS OVERVIEW
2.1. BUSINESS DESCRIPTION
Foot Locker’s parent company was originally called Woolworth, which later became Venator, which in turn, because Foot Locker had become its main banner, changed its name again to Foot Locker Inc. (more less the opposite from what happened to Google/Alphabet). It’s a great story and you can read it here.
The Foot Locker (FL) we know today is a multi-brand footwear and athletic apparel retailer with more than 3200 stores across 24 countries. It operates under the banners Foot Locker, Kids Foot Locker, Lady Foot Locker, Champs Sports, Runners Point, among others. We can easily recognize its store employees by their referee outfits and its stores by the loud music they play.
2.2. LARGEST SHAREHOLDERS
The largest shareholders are the usual suspects : Vanguard, Blackrock…..

2.3. MANAGEMENT TEAM
Johnson is in the company since 2003 and has been the CEO since 2014.

3. HISTORICAL CONTEXT
3.1. LONG TERM CHART
Foot Locker has had some big drawdowns in its history. In 1998 it dropped 76%, in 2008 50% and just recently in 2017 the share price dropped 60% after a super run since 2009. As of this writing the stock price is at $62,78.

3.2. MARKET CAP AND SHARES OUTSTANDING
The number of shares outstanding is at an historical low of 116 Million, 40 million less than in 2010 when the company started buying back its own shares. The Market Cap is $7.1B right now.

3.3. SALES - OPERATING INCOME - OPERATING MARGIN
Sales have been growing at a 6,1% yoy rate since 2009 but that growth has been slowing down. For 2018, total revenue was $7,9B, a 2% increase from 2017, while the operating income was $699M representing a 9% margin.

3.4. SALES BY GEOGRAPHY
The 2018 geographical breakdown isn’t out yet so I’ll be using 2017 numbers.

The U.S.A is their largest market accounting for 71% of sales.
3.5. SALES BY SEGMENT
Unfortunately Foot Locker doesn’t disclose figures by banner. Instead, they differentiate revenue coming from physical stores and from online sales.

Online sales are growing, but they represented just 14% of total sales in 2017.
3.5. GROSS MARGIN
The gross margin was 32% for the last couple of years.

3.6. COMPARABLE SALES
Foot Locker’s comparable sales increased 2,7% in 2018 related to the prior year.
3.7. NET INCOME, NET MARGIN
Net income in 2016 was much higher than in 2015 because of an extra week in the year and in 2017 net income took a hit because of the TCJA.
In 2018, the net Income was $541B and the net margin 7%.

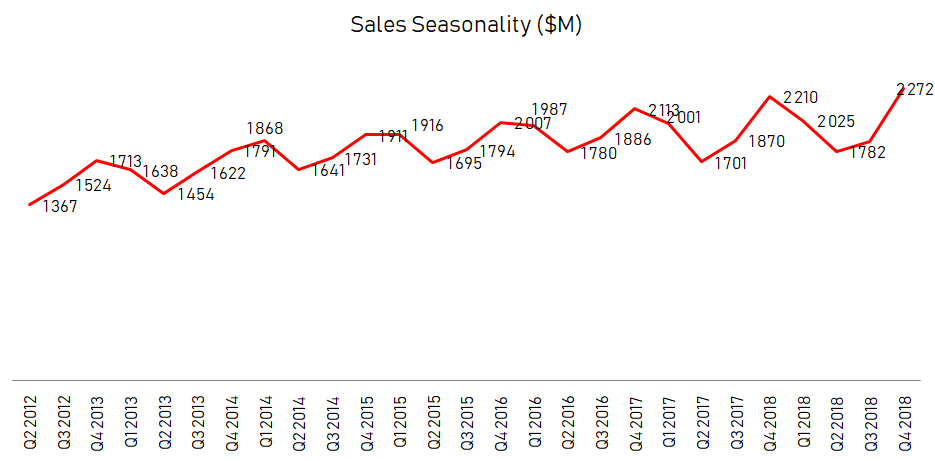
3.9. SEASONALITY
There is a high seasonality factor to Foot Locker’s sales. Not surprisingly, the 4th quarter is usually the strongest one.
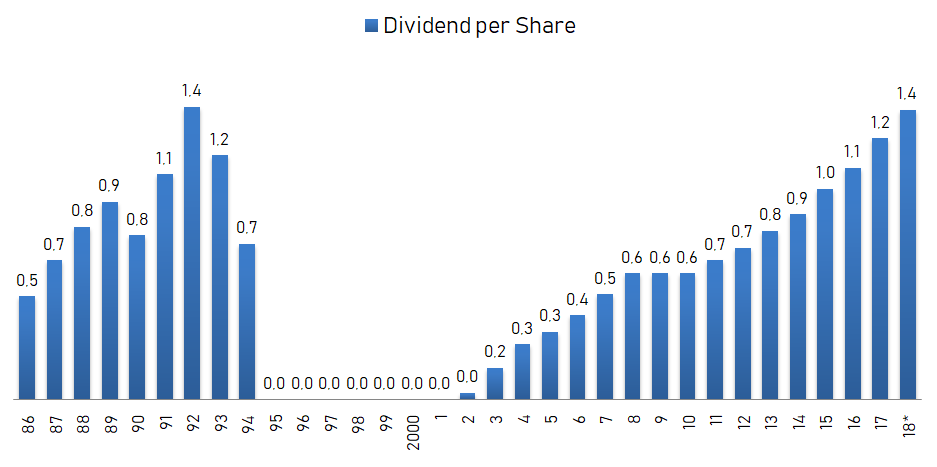
3.10. DIVIDENDS
The company has been raising its dividend since 2002 and the dividend yield is at 2,42%.
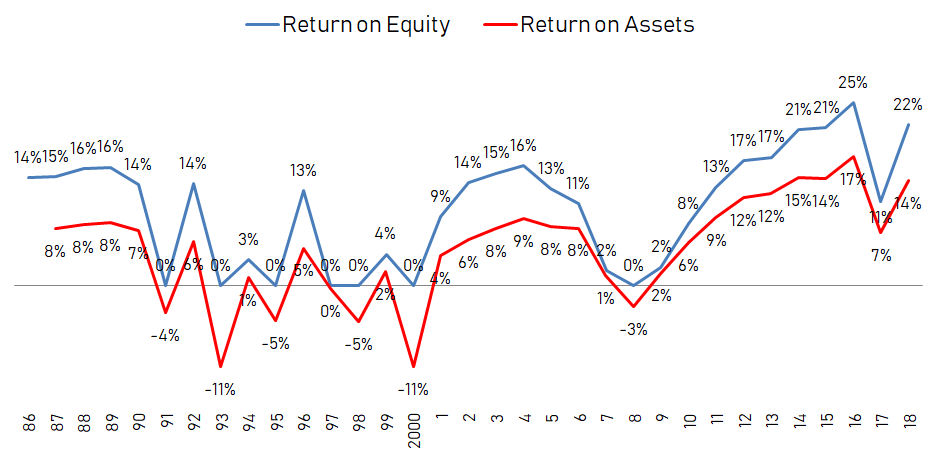
3.11. PROFITABILITY RATIOS
Ever since the financial crisis, ROE is showing a positive trend achieving levels above 20% in recent years.
3.12. FINANCIAL RATIOS
Foot Locker has a very strong balance sheet with $124 million of debt against $891 million in cash, which is a good cushion in case of a bad performing year or in case of a big acquisition. The current ratio is at a perfectably sound 3,3.

3.13. PRICE RATIOS
Taking into account the most recent estimates, the 2019 forward PE ratio is 13, which isn’t that far from the historical PE ratio of 14.

4. GAINING PERSPECTIVE
4.1. INDUSTRY AND STRATEGY
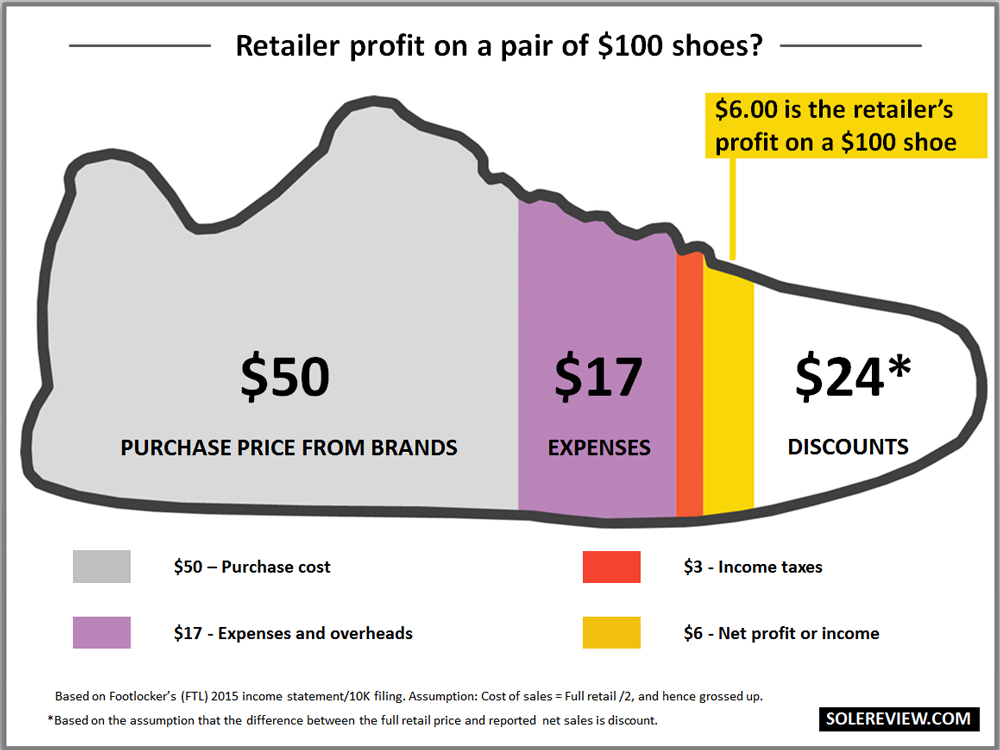
Before we go on, I would like us to understand the general economics of this business with the example of a Nike shoe shown in the two images bellow:
For a typical $100 shoe, Nike usually gets $5 in profit.
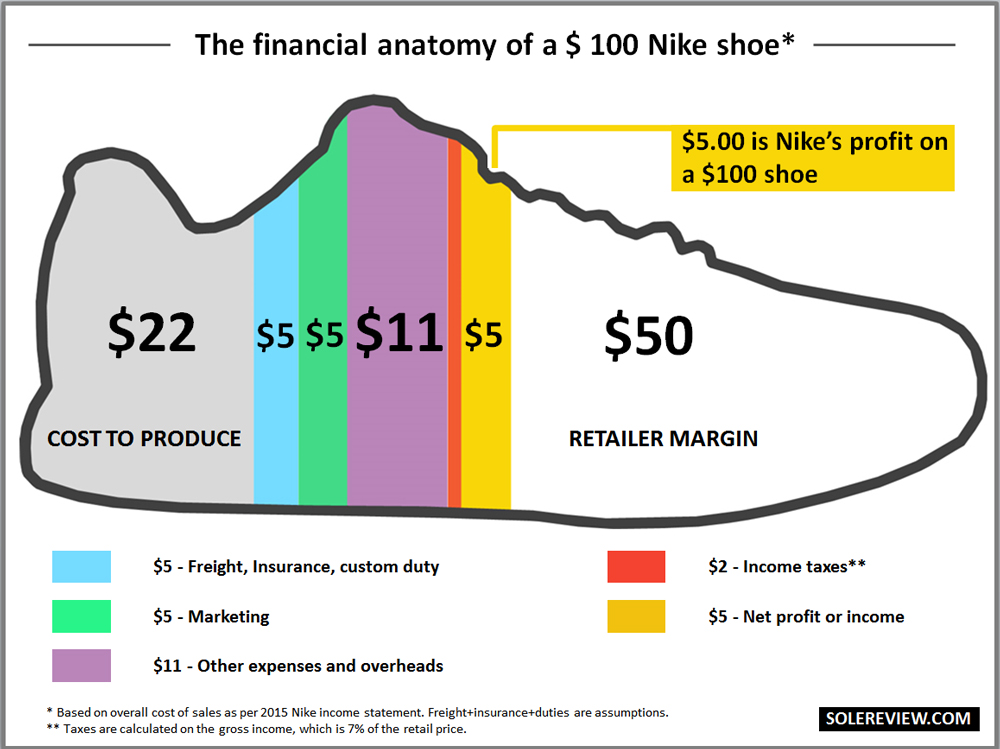
And from the $50 left for the retailer, net profit is about $6.
4.2. RISKS AND COMPETITION
Retail in general is undergoing serious transformations and the biggest risks FL is facing are:
- Threat by other e-commerce platforms: Amazon, Nike, etc.
- The inability to control the product they sell: Recently sales were down because of a lack of innovative products from Nike.
- Supplier concentration: Foot Locker is highly dependent on one supplier. In 2017 67% of all the purchased merchandise was from Nike. This is something I don’t like to see and I hope management directs its efforts in order to reach a more comfortable level of supplier diversification. In further analyses, I will be on the look out for this.
- Less foot traffic in malls.
4.3. TYPE OF PLAY
I consider Foot Locker a growth play.
5. OVERVIEW AND CONCLUSION
5.1. OVERVIEW
Although Foot Locker is a worldwide recognizable brand, I don’t think people shop at its stores because of the brand. People are more interested in having the latest Nike’s shoe rather than buying it at a specific location.
I’ve talked to a couple of sneakerhead friends and they tell me they buy sneakers online directly through the brands websites or some exclusive e-commerces.
I know, I know, a couple of friends can’t be considered a well-diversified sample but I get the feeling that regarding e-commerce, people just don’t care who they get their shoes from just as long as they get them at a good price.
Although FL is well positioned to continue to be the top sneakers brick and mortar retailer, I think they will have a hard time going forward. Bearing in mind the two images I posted previously, why wouldn’t Nike try to earn $11 on each pair of sneakers sold through its online platform, rather than just $5 through Foot Locker?
But for the sake of the argument, let’s say that the trends we’ve seen recently will be maintained for the next 5 years:
Brick and Mortar sales will grow at 2% yoy.
Online sales will grow at 12% yoy.
Net margin will be maintained at 7%
No further share repurchases.
In 2023 sales will reach $9,7B, and net income $680M. At the historical PE of 14, we get to a market cap of $9,5B. Throw in a 2,4% dividend yield and we get to a CAGR of 8,4%.
Although the company has had a lot of success on their strategy so far, this is still a brick and mortar retailer with low margins and an extremely high dependence on one supplier. Going forward, I would like to see more money coming from the online sales and a larger supplier diversification and/or their own brands gaining some traction.
I would like to finish this analysis with a request to whoever is in charge of it over at Foot Locker: Please lower the music volume in your stores.
5.2. CONCLUSION
This section will be available to paying subscribers in 2019 when we launch the Portfolios. If you’d like to get early-bird conditions, please send us an e-mail.
Don’t forget to check our other analyses. If you want more, join us at our new Facebook group.
6. DISCLAIMER
The material contained on this web-page is intended for informational purposes only and is neither an offer nor a recommendation to buy or sell any security. We disclaim any liability for loss, damage, cost or other expense which you might incur as a result of any information provided on this website. Always consult with a registered investment advisor or licensed stockbroker before investing. Please read All in Stock full Disclaimer.