Medley #6
HireQuest, MTY, and Inditex

By Manuel Maurício
March 18, 2022
HireQuest
HireQuest’s management just keeps on delivering.
*If you’re new to HireQuest I suggest reading my previous write-ups here.
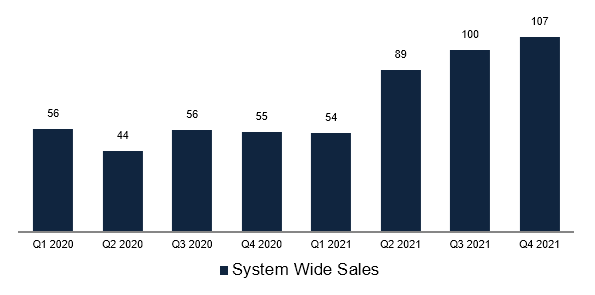
System-Wide-Sales for the quarter have gone up by 95% to $107 million.
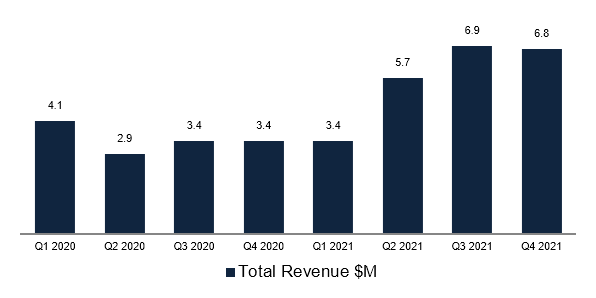
While revenue has gone up by 100%.
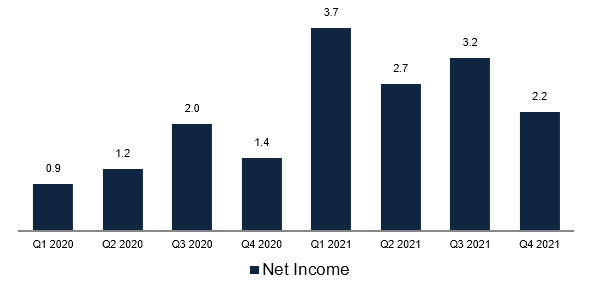
Leading to a 57% growth in Net Income.
There are several factors impacting these numbers, from the positive effects of the recent acquisitions to the negative effects of the pandemic so we should be looking at them at with a bit of caution.
Without the added benefits of the acquisitions revenue would have grown organically by 47%. Pretty good, but still highly influenced by the lower activity experienced during the pandemic.
I have the feeling that HireQuest is one of those companies that will mess up my Excel model every quarter because of the acquisitions and related adjustments and one-off costs.
Either way, we should be looking at the big picture which, for me, is the repeatability of the growth model at attractive rates of return.
I believe we’re just in the first innings of what the CEO, Rick Hermanns, can do.
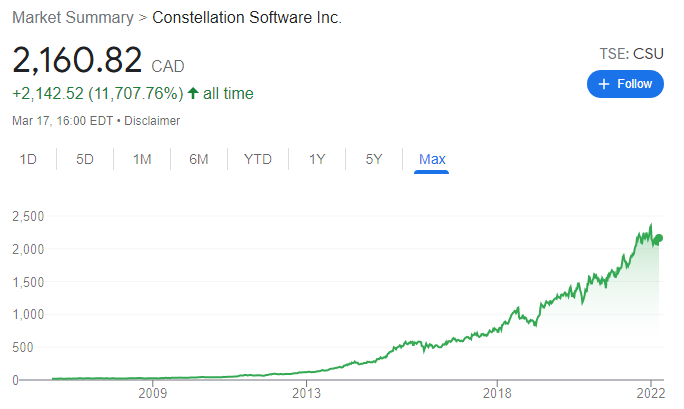
In fact, I’ve seen fellow investors comparing him to Mark Leonard of Constellation Software (arguably one of the best CEO’s and one of the best companies in the World). Constellation Software is a software business that grows by acquisitions. But instead of the traditional acquiring model where the capital allocation decisions are centralized on one key decision maker – ofte the CEO – Constellation incentivizes its branch managers to go out and find new opportunities. This decentralized engine has created amazing returns for shareholders over the past 30 years.
I don’t think that HireQuest franchisees are given as much slack, but Rick is incentivizing them to expand by giving them the money they need.
CAPITAL ALLOCATION
Now, over a short period of time, I expect HQI’s Return on Invested Capital to be noisy and erratic just because of the acquisitions, but over a period of a few years we should be getting a good picture.
In 2021, the Return-on-Equity has been 25%, which is very good. At these rates, the company should be reinvesting all of the excess cash back into the business.
I wonder why they chose to pay a regular dividend. My guess is that the CEO wants to be using HireQuest’s shares as currency for future acquisitions and the dividend will attract more investors, thus leading the stock price higher. This is just speculation from my end, and I don’t know if I’ll ever be able to confirm it.
On the recent Conference Call Rick said that there are plenty of potential targets out there. He continues to say that he’s not pursuing growth for growth’s sake. He’s looking to acquire companies that are accretive to earnings.
And regarding acquisitions, Rick says that he’s looking at several targets; people who were putting off deals due to the pandemic want to sell now so there will be more deals coming.
If there was one negative aspect on the call was the recognition that the recently launched DriveQuest segment – aimed at truck drivers – has been a flop. I should be taking managemet’s guidance with a grain of salt going forward.
HIREQUEST CONCLUSION
Just like with a few other companies in the Portfolio, there are some material risks that are stopping me from increasing my stake in HireQuest. In this case, the related-party transactions between the CEO and the company are a yellow flag. I’ve written about it before.
Having said that, this is truly a beautiful model and the CEO appears to be one of those rare, amazing, capital allocators.
I expect to be owning HireQuest’s shares for many years.
MTY Food Group
MTY Food Group is one of those companies that I liked until I read Terry Smith’s article on Tesco. If you like investing in stocks, I highly recommend reading it.
*If you’re new to MTY Food Group I suggest reading my previous write-ups here.
In it, Terry makes the point that Tesco was growing its Earnings-Per-Share by investing more and more capital into the business.
That was not the problem though. The problem was that the returns on that capital had been decreasing dramatically over the years. That’s a sign of trouble. And it got me thinking. How would that framework apply to other companies?
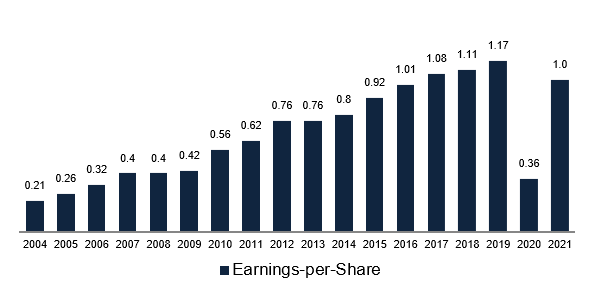
The chart below shows the evolution of both the EPS and the Return-On-Invested-Capital (ROIC) for MTY Food Group from 2005 to 2019. I purposely left 2020 and 2021 out for obvious reasons.
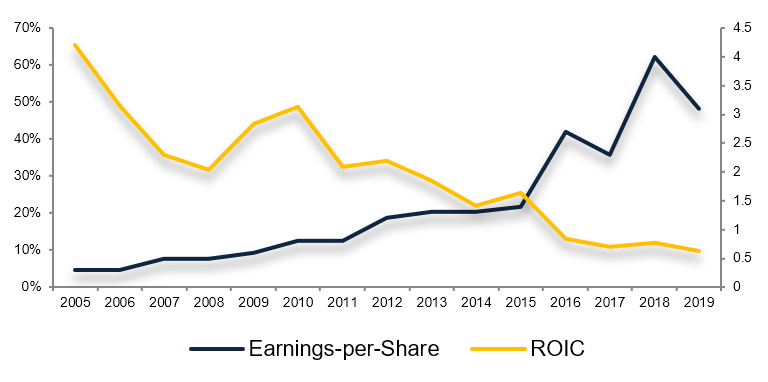
It’s clear that the company has had to deploy more and more capital (in the form of acquisitions) at lower-than-optimal rates of return to make those earnings grow.
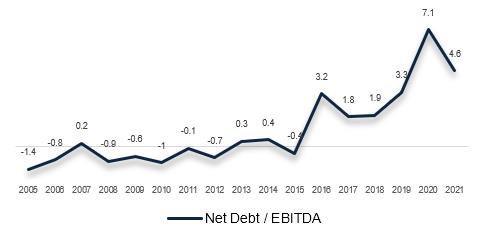
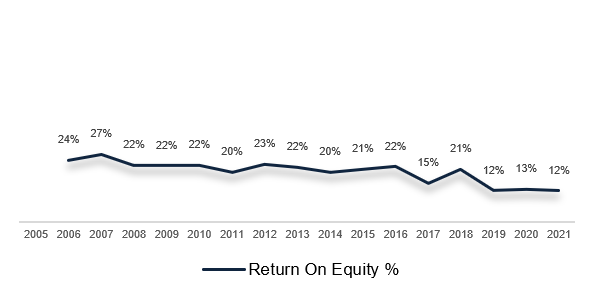
To add assault to injury the company has been pouring more and more debt into the business. This has had the effect of making the Return-on-Equity look better than the Return-on-Invested Capital (Financial technicalities, I know, but they serve to make a point).
Just like with Tesco, this higher debt has only served to make the business riskier (😉 Diogo Gonçalves).
With higher debt, one should expect the Return-on-Equity to have gone up over the years, but that hasn’t happened either.
Now I’m not saying that MTY is facing bankruptcy risk, but the returns on the acquisitions have deteriorated over the years. MTY seems to be breaking under its own weight. The larger it gets the harder it is to sustain growth as it needs to make larger and larger acquisitions which will came at higher valuations.
I’m looking for companies with increasing returns on invested capital, not decreasing.
Now, the finance geeks might tell you that the underlying business is very good and that these returns are highly influenced by the premiums paid for the acquisitions.
All true, but for a company who’s been growing through acquisitions for the past, what, 3 decades? why on earth should one leave the effects of those acquisitions out of the equation?
This discussion (going on inside my head, it’s like there’s 2 of me) has led me to go back and study some of the concepts that I’ve been following in recent years. So much so that I’ve ordered the book “Valuation” just to go trough the part where the authors talk about calculating ROIC with and without Goodwill and Amortization (geeky stuff, I know).
I had already read this excellent book in PDF format, but I figured that an investor worthy of such title should have the print edition. Coincidently enough, it has just arrived this morning.

But I digress. Yes, it’s true that the stock is at 8 or 9x Free Cash Flow and that looks cheap. But that steady decline in returns has left me weary of the business prospects going forward.
I’ll be keeping MTY on my radar as a means to prove or disprove my convictions on capital allocation. I’ll be getting back to it from time to time, but I’m not buying the stock.
INDITEX
And we’ve now come to the Inditex update.
*Previous write-ups here.
Let’s look at the relevant metrics before talking about the returns on capital.
The company has been shrinking the number of stores…
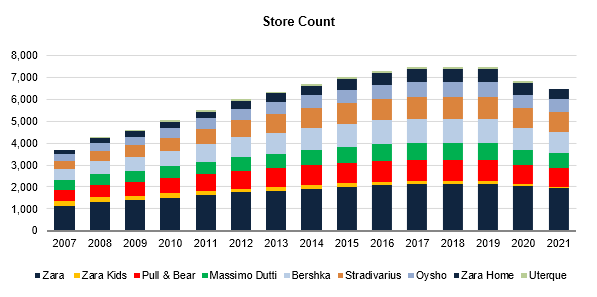
…but by increasing the size of each store…
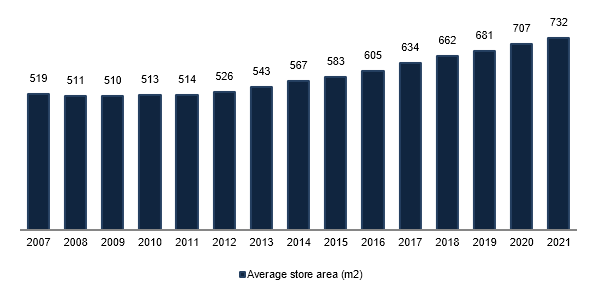
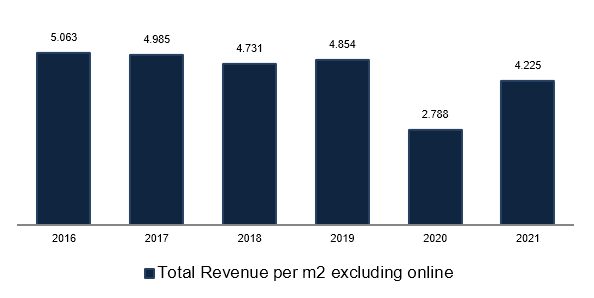
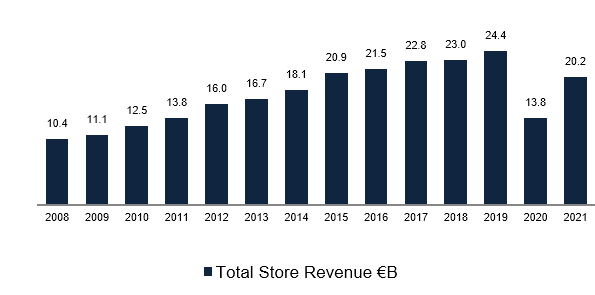
… at a faster pace than the decline in revenue per m2…
…they’ve been able to grow the revenue coming from the stores…
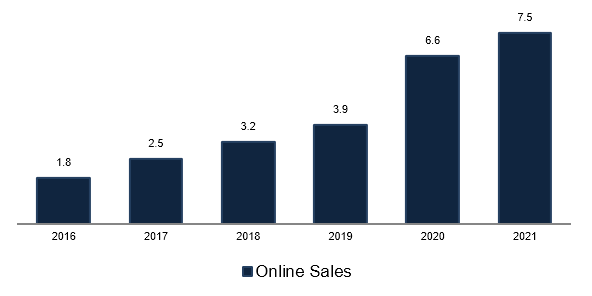
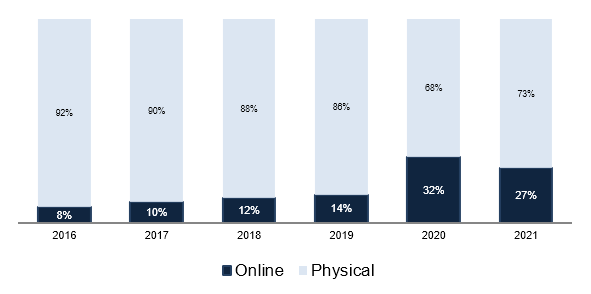
If I were to guess the reason for the decline in revenue per m2 I would say that it might have something to so with the growing online sales cannibalizing the store sales. It’s important that investors in Inditex keep an eye on the “Revenue per m2” and compare it to the “Online Sales”.
By closing smaller stores and consolidating its footprint into larger, more recognizable stores, the company is able to (1) absorb most of the lost revenue from the closed stores through the larger ones, (2) reduce operating costs as 1 larger store will cost less to maintain and to stock up than several smaller ones, and (3) tie up less capital in inventory.
Not only that, but the company has been using the stores as distribution centers for the online business, which is expected to reach 30% of revenue in 2024.
All of this has led to growing earnings per share (excluding the pandemic years)…
… whereas the Return-on-Invested-Capital has been quite steady, consistently above 50%.
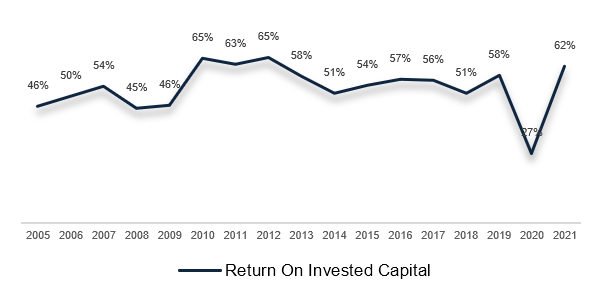
I would say that we might be seeing it go even higher now that they’ve concluded their store optimization program. That’s good.
In the short term we’ll be seeing some weakness coming from Russia – representing 8.5% of EBIT – and probably some increased competition from Shein and the likes, but it looks like Inditex’s management knows its industry very well and they’ve been shifting away from the price competitive space where Primark is (and to some extent H&M) by creating an image of higher end products.

The stock price is currently trading at a PE ratio of 18x which is kind of cheap if we compare it to where that multiple has been for the past 10 years.
If they grow their footprint by 2.5% each year (as is their plan) and keep the revenue per m2 at around €4.500, in 5 years we would be talking about €24.1B in revenue coming from the physical stores. If we add to that €14B in online sales (twice as much as today), that’s a grand total of €39B in sales. At a 13% net margin and a PE ratio of, what, 20x? the share price would be 33€. Add to that €8 per share in cash accumulated in the meantime and we get to an annualized rate of return of 14.3%. Heyyy! Inditex might actually be a good investment opportunity at these prices.
As always, if you’d like to discuss any of these stocks, just head over to the Forum and speak your mind my friend.
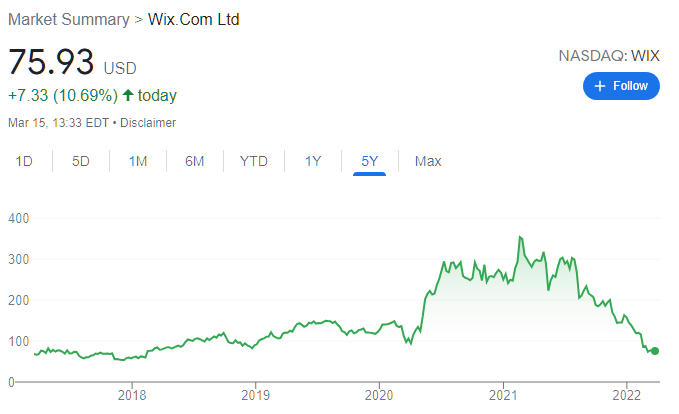
WIX
WIX is that stock that I think I would’ve liked to buy back in the pandemic crash, but now I’m not so sure of it.
It’s tricky to do the same ROIC exercise for WIX for the simple fact that the business has no profits.
WIX is one of those software companies with – allegedly – so great unit economics, that the only thing it should be doing is to reinvest every dollar in Sales & Marketing to attract new users.
This is true for most SaaS businesses out there. It is also what led investors to pile up onto these stocks and, for some unkown reason, to dump them recently.
Shopify is another…
Spotify is another…
…and so on and so on.
I could do a bunch of calculations to try to estimate what percentage of its current spend in Sales & Marketing is needed to maintain the current state of the business and what percentage is directed to growth, but that wouldn’t be very accurate.
So what else can we look at to see if WIX is heading in the right direction?
CAC/LTV I think would be my favorite. It relates the customer acquisition costs to the lifetime value of each customer. Both these metrics are subject to estimates, but still…
Now, WIX might still be here 10 years… fb…online commerce is shifting. I don’t claim to know the future, but it’s evident to me that we’re going more in the direction of the Chinese super apps with everything integrated. Maybe websites won’t be as useful n the future as they are now because you’ll be having your store inside the Facebook ecosystem or any other.
I’ve mentioned this before. Soon merchants will be able to have their stores inside Facebook. And so will content creators like me. Facebook will give increased visibility to these creators and merchants. I’m not sure of the legal implications of this, but it wouldn’t surprise me to see Facebook giving better advertising deals to people selling their products and services through Facebook instead of through their websites.
Does this mean that websites are dead? No. But it means that the landscape may change significantly going forward and the retention rates for WIX might get harmed.
DISCLAIMER
The material contained on this web-page is intended for informational purposes only and is neither an offer nor a recommendation to buy or sell any security. We disclaim any liability for loss, damage, cost or other expense which you might incur as a result of any information provided on this website. Always consult with a registered investment advisor or licensed stockbroker before investing. Please read All in Stock full Disclaimer.