Microsoft,
A fundamental analysis
Microsoft,
A fundamental analysis
SHARE PRICE: $107.22
MARKET CAP: $822B
1. INTRODUCTION
I think it’s safe to say we all know Microsoft and its founder Bill Gates. Ever since Windows came out, this company’s products have been on the homes of millions. Lately I’ve been hearing a lot of fuss about Microsoft so I decided to look it up. I’ll start by taking a look at their website.
2. BUSINESS OVERVIEW
2.1. BUSINESS DESCRIPTION
Microsoft is the largest software company in the world. They got to be where they are today because of Windows, the operating system everyone knows (and some hate). Albeit being the company’s cash cow for decades, it seems that recently they are pursuing a different strategy.
Microsoft defines its segments as:
Productivity and Business Processes: Office Commercial, Office Consumer, Linkedin
Intelligent Cloud: Server products, Enterprise Services
More personal computer: Windows; devices (surface, etc)
Gaming: Xbox
Search: Bing
2.2. LARGEST SHAREHOLDERS
The largest shareholders are the big funds, but it’s good to see that Bill Gates is still up there with 1,35% of the company.

2.3. MANAGEMENT TEAM
Satya Nadella has been the CEO since 2014, when he succeeded Steve Ballmer, coming from the cloud division where he stood out by making it the fastest growing division in the company.
Satya has been the responsible for one of the biggest turnarounds in history, one that ultimately led to the tripling of the stock price. The shift between traditional software sales to a subscription based SaaS (software as a service), taking advantage of the Cloud. By making the change to a subscription based recurring revenue model, he has been able to bring stability and predictability to the revenue.

3. HISTORICAL CONTEXT
3.1. LONG TERM CHART
We can clearly see two big drawdowns after the dot.com bubble and the financial crisis of 2008 and an incredible rise in the share price starting in 2014, coinciding with the beginning of Nadella’s tenure.

Disregarding the 2008 dip, the stock price didn’t move much between 2000 and 2014. That was when everyone was looking at Microsoft as a mature company without major growth prospects.
Regardless of that, since the IPO, the stock price has returned an amazing 23% CAGR for shareholders.
3.2. MARKET CAP AND SHARES OUTSTANDING
The number of shares outstanding is now more less the same as it was at the time of the IPO in 1986. The company has been buying back shares since 2006 and the market cap is $822B today.

At this valuation, Microsoft is up there head to head with Amazon fighting for the title of world’s most valuable company.
3.3. SALES - OPERATING INCOME - OPERATING MARGIN
In 1986, Microsoft’s revenue was “just” $197 Million and for the 2019 fiscal year (ends in June 2019) analysts are expecting it to be $124 Billion, growing 12% from 2018 numbers.

Sales have been growing in amazing fashion at a compound annual rate of 22% for 33 years!!!
It really is as Buffett and Munger say “You only need to find two or three companies in your lifetime“. Of course, saying that is the easy part, the hard part is knowing which companies to buy and hanging on to them through the years.
If you take a close look the chart, you will notice that in 2015 the operating income took a nosedive. That was due to the Nokia write off in 2015 for $7,6B, virtually all the money paid for its acquisition.
3.4. SALES BY GEOGRAPHY
The USA is by far their largest market representing about half of the total revenue.

3.5. SALES BY SEGMENT
Who would’ve said? For those of you who thought Microsoft was just Windows, try this: Office and Servers (Cloud baby!) are the main revenue drivers by far.

And while we’re at it, do any of you guys use Bing? Well, I bet you didn’t know this: Bing brings home $7 BILLION every year!?! Yeah, you heard me right!
7 Billion dollars. I’ll leave you with this interesting video:
3.6. SALES EVOLUTION BY SEGMENT
I usually like to check the different segments evolution so I can see what is coming:
Microsoft has so many products that this chart might be confusing for some of the readers out there. What matters most is that both Cloud services are leading the way for growth.
Windows doesn’t seem to be slowing down. In fact Windows revenue is slightly going up. Devices had a spike in 2015 but is now decreasing and Linkedin is soaring. Gaming is going up too.

3.7. NET INCOME, NET MARGIN
Historically net income has grown at a CAGR of 23%, exactly like the stock price.

The sudden fall in profits in 2018 is a recurring thing on American companies and is due to the Tax Cuts and Jobs Act (TCJA)

If it wasn’t for this one time tax, net income would’ve likely reached $28 Billion.
3.8. RESEARCH AND DEVELOPMENT
When analysing software companies, a metric to look at is the money spent on Research and Development (R&D). It’s not that important to look at the absolute value but to compare it to sales. Microsoft has been able to keep this rate steady for the last 6 years at around 13%.

3.9. DIVIDENDS
At first, I thought that that 2005 dividend was a glitch on my data, but no. This was a huge special dividend of $3/share.
As companies mature and can’t find ways to profitably deploy all the cash they earn, they distribute it to shareholders via buybacks or dividends. The dividend yield is currently at 1,7%.

3.10. PROFITABILITY RATIOS
Return on equity has been historically a bit bumpy but we can say that at 37% expected for 2019 we are talking about a great company here.

3.11. FINANCIAL RATIOS
Current ratio is a sound 2,9 and debt to equity at 0,9. Just look at how long Microsoft was able to thrive without any debt!!!

Although the Debt-to-Equity ratio is at levels I’m usually not fond of, the cash on the balance sheet more than offsets all of the debt. If the company wanted to, it could immediately pay out all of its debt, and still keep $87B.
Curious fact: Microsoft and Johnson & Johnson are currently the only two companies in the world being given a AAA rating.
3.12. PRICE-TO-EARNINGS AND PRICE-TO-SALES
I would like to look at the Price-to-FCF but unfortunately I don’t have that data here, so let’s take a look at the PE.
Forward 2019PE is at 23 and the historical average for Microsoft has been 29. It wasn’t that long ago that we could find Microsoft at a PE of 9 like in 2011. Obviously like any other tech company, its PE was far too exaggerated in 99 and 2000.
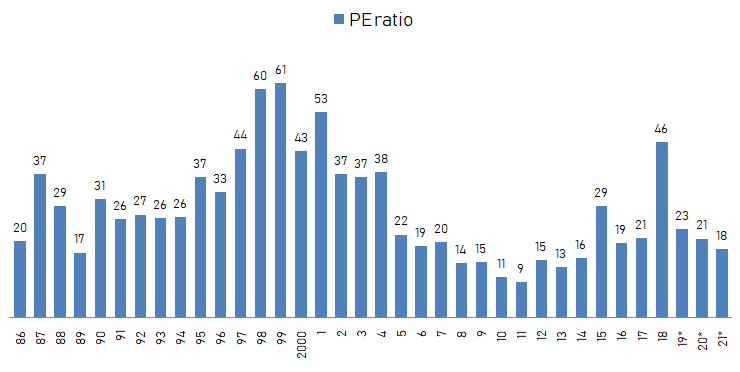
Recent PE of 46, like we’ve seen previously, needs to be adjusted due to the one time tax the company had to pay.
It’s funny to understand why the stock price didn’t move between 2000 and 2014 while sales and profits were getting better. The company went from an over-valuation situation to an undervaluation situation. So, although the fundamentals were all becoming better, price didn’t move. Mr. Market is a funny guy.
When we analyse software companies, it’s also good to take a look at the Price-to-Sales ratio.
At a price-to-sales of 6,3 for 2019, we could say that, in absolute terms, Microsoft is overvalued, but we are talking about a great tech company, so that may not be necessarily true.
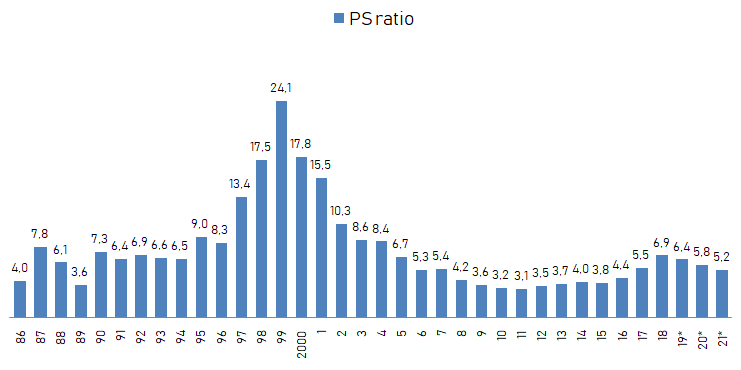
Of course, that spike leading up to the 24 P/S ratio in 1999 was completely nonsense. It’s amazing how we can so clearly see the dotcom bubble and how it unfolded.
I think we can take some serious conclusions out of this example:
“Don’t overpay for companies, even if they are great businesses.”
3.13. RISKS AND COMPETITION
Two of Microsoft’s biggest risks are competition, and strategy:
While the current CEO has done a remarkable job leading the company to a SaaS subscription model based on the cloud, the previous CEO was widely seen as disastrous (Do you remember the Windows phone?). This means that the strategy management pursuits is one of the most important things for Microsoft.
Microsoft owes its recent spectacular growth to the Cloud, namely Azure, but this is a market with ever increasing competition, from big and small players, and Microsoft might not be able to grow sales at the rhythm it has for the last 5 years.
4. GAINING PERSPECTIVE
4.1. INDUSTRY
The cloud business has been growing a lot in recent years. The front runner in this business is Amazon with it’s AWS, but Microsoft is in second place, and growing a lot too.
It is projected that Microsoft Azure will reach the $54 Billion mark in 2023 from “just” $9B in 2018.

4.2. SEASONALITY
Revenue tends to be higher on the 2nd quarter of Microsoft’s fiscal year. The 2nd quarter ends in 31 of December so it coincides with corporate year-end spending and holiday spending by consumers.
4.3. TYPE OF PLAY
For the reasons stated above, I consider Microsoft a growth play.
4. OVERVIEW AND CONCLUSION
4.1. OVERVIEW
Microsoft is an amazing company. It has high switching costs, great historical sales growth, strong balance sheet with net cash available for acquisitions and great industry tailwinds with the cloud business going to the moon.
But it’s also clear that there was a great time to buy Microsoft, when its multiples were depressed, between 2008 and 2015, the time when no one believed in Microsoft’s ability to grow.
Microsoft’s revenue has been growing at a 6% yoy for the last 5 years. Let’s say that this growth rate will go to 10% yoy and in 5 years time the net margin will reach 30%. In 2023, revenue will be $177B, and net income $53B. At a conservative PE of 20, the whole company will be worth $1,06T. If we add back the $250B of cash that the company will generate until then, we get to a Market Cap of $1,31T. That represents a 10% CAGR from today’s Market Cap of $822B.
As I am looking for a mid teens CAGR, the question I must ask myself is: Is Microsoft able to grow more than 10% yoy? It might be, but I cannot say that for sure. And if I’m not certain, I don’t invest.
“With great discipline, come great results” – me
4.2. CONCLUSION
This section will be available to paying subscribers in 2019 when we launch the Portfolios.
If you want more, join us at our new Facebook group.
5. DISCLAIMER
The material contained on this web-page is intended for informational purposes only and is neither an offer nor a recommendation to buy or sell any security. We disclaim any liability for loss, damage, cost or other expense which you might incur as a result of any information provided on this website. Always consult with a registered investment advisor or licensed stockbroker before investing. Please read All in Stock full Disclaimer.