3M, the dividend machine
SHARE PRICE: $197
MARKET CAP: $114,65B
1. INTRODUCTION
Back in 2017, I had the opportunity to visit the 3M Brazilian headquarters near São Paulo, Brasil. I was amazed!.
These guys were making everything. They had a big warehouse serving as a showroom for all their divisions. They call it “Customer Innovation Center”. It was like being in a shopping mall where everything was the same brand. Each division has its own “shop” where clients could test the products.
There was a shop for adhesive films for windows, there was a shop for personal safety items like hardhats, boots and gloves, there was this “invisible” fluid that extinguishes candles on the fire protection section, there was even a dental clinic so that dentists can go there and test 3M sutures on real patients.
I don’t know about you, but I had never been to a place like that before. It was like Disneyland for grownups. The thing that kept coming to my head was “How many products do these guys make?”. The answer is more than 55 000!!!
2. BUSINESS OVERVIEW
2.1. BUSINESS DESCRIPTION
3M is one of the world biggest industrial conglomerates. It makes and sells so many different products that it is practically impossible to enumerate them all. To keep things simple, they organize them in 5 distinct segments:
• Industrial: Automotive original equipment (OEM), adhesives, tapes or abrasives, window films, etc
• Safety and Graphics: Goggles, ear plugs, hardhats, as well as commercial graphics sheeting, reflecting gear…
• Health Care: Medical tapes, wound closure products, metered-dhose inhalers among many others
• Electronics and Energy: Infrastructure protection, telecommunications networks, power generation and distribution…
• Consumer: Stationery products, drug and pharmacy retail, consumer health products…..Scotch tape, Post-its…
2.2. LARGEST SHAREHOLDERS
The largest shareholders are all big funds, Vanguard Group being the largest one.

2.3. MANAGEMENT TEAM
Michael Roman is the 30 year 3Mer who took charge of the company on July 2018. I like to see that the General has come from the lower ranks rather than being brought from the outside.

3. HISTORICAL CONTEXT
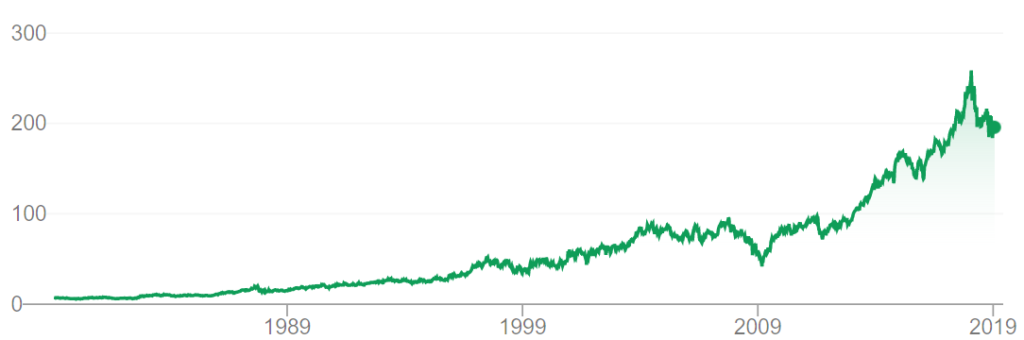
3.1. LONG TERM CHART
The IPO was in 1978 and if you would’ve bought shares back then and held them until now, you would’ve gotten an 8,5% CAGR (dividends not included). The stocks is now trading at $197.
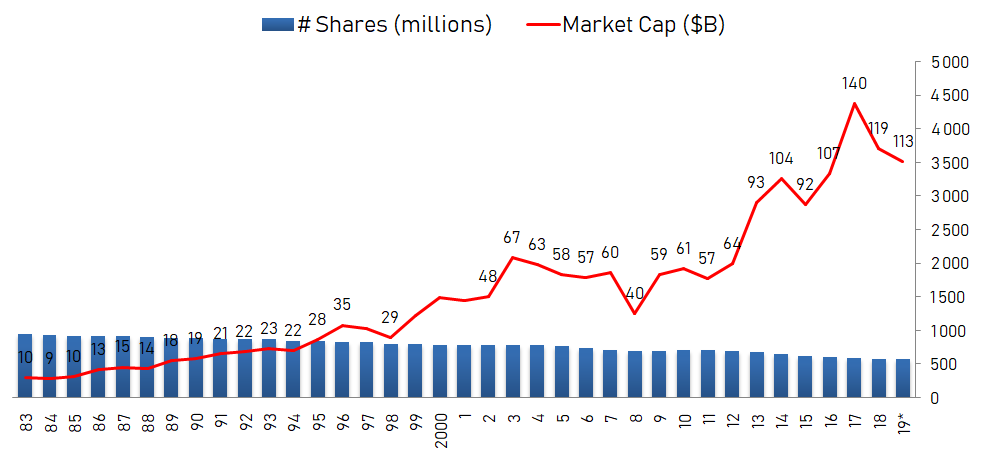
3.2. MARKET CAP AND SHARES OUTSTANDING
The number of shares outstanding is slowly decreasing throughout the years, and with the 2016 Share Repurchase Program in full swing, which authorized the repurchase of up to $10 Billion, we will likely see this number decrease even more in the coming years. In 2018 alone, 3M repurchased $4,9 billion of its own stock.
3.3. SALES - OPERATING INCOME - OPERATING MARGIN
Sales for the last 10 years have been on a slow rise reaching $32,7B in 2018. The operating income in 2018 is down to $7,2B from $7,6B a year ago.

3.4. SALES BY GEOGRAPHY
Let’s see where they sell the most. I have a hunch the U.S.A is their largest market.

There it is. The USA is the main market followed by Asia Pacific and Europe/Middle East and Africa coming in 3rd place.
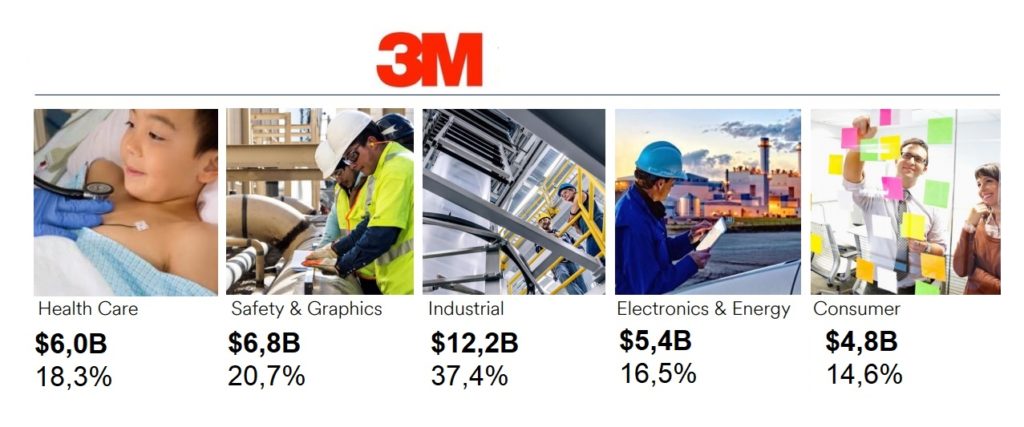
3.5. SALES BY SEGMENT
The Industrial segment is the strongest one with $12 Billion in sales in 2018 followed by Safety and Graphics with $6.8 Billion.
3.6. SALES EVOLUTION BY SEGMENT
Throughout the years, the Industrial segment has been the best performing segment by far, and it seems that safety and graphics is rising slowly.

3.7. NET INCOME, NET MARGIN
Net income for 2018 was $5,3B and analysts expect it to go mucher higher in the coming years given the fact that both in 2017 and in 2018 the company recorded one time expenses regarding the TCJA and legal settlements.

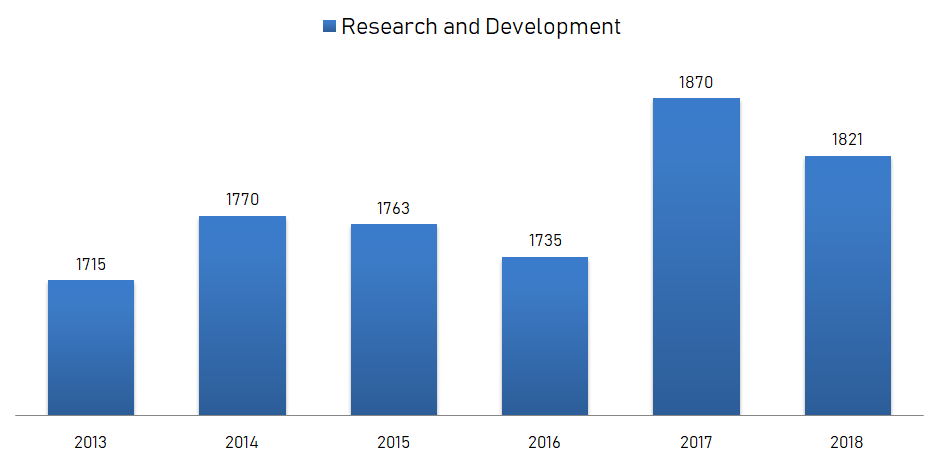
3.8. RESEARCH AND DEVELOPMENT
The R&D expenses have been quite stable over the recent years, with increased spending in 2017 and 2018.
3.9. SEASONALITY
There is some seasonality to 3M’s sales, the third quarter usually showing the highest revenues for the year.
3.10. DIVIDENDS
Usually I don’t care that much about dividends but the fact that 3M has been paying them to its shareholders for more than 100 years and raised them for 59 years in a row is worth mentioning.

3.11. PROFITABILITY RATIOS
Return on equity has been rising in recent years, not because 3M has earned more money, but because the equity is reducing. That’s why I like to compare it to the Return-on-Assets. As we can see, ROA has been pretty stable in the mid teens over the years, which I consider a good ROA.

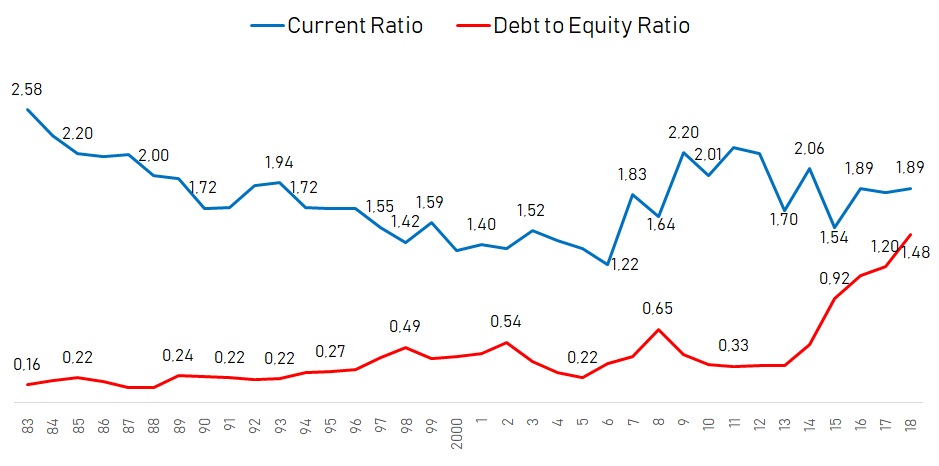
3.12. FINANCIAL RATIOS
The debt to equity ratio has been deteriorating slowly over time, specially in the last 3 years, but at 1,48 I consider it to be at an acceptable level for such a stable company.
The Current ratio (which measures the solvency of the company on the short term) is above 1,5 which is good. In the last 10 years it has never declined below 1,5.
3.13. PRICE TO EARNINGS RATIO
The 2019PE is at 19, a number I don’t consider neither high nor low for a slow growth company. I would say the company is correctly priced by Mr. Market.

3.14. RISKS AND COMPETITION
As one of the most diversified companies in the world, regarding products and geographical distribution of its clients, there isn’t one big risk that can affect it and the risks are mostly tied to the U.S. and China economies, the rise of oil prices, or a political hard shift on any of the countries where it makes business.
Given the fact that 3M makes thousands of products across a wide range of industries, it has many competitors on each of those industries. There is no great competitor for 3M as a whole. The company’s sheer size and diversity of products makes it hard to compete with as a whole.
3.15. TYPE OF PLAY
I consider 3M a dividend play.
5. OVERVIEW AND CONCLUSION
5.1. OVERVIEW
3M is a mature company and its days of high growth are way past behind it. It’s even a bit boring analysing it.
So let’s be optimists and say that for the next 5 years revenue is going to go up 3% a year and net margin will reach 19% in 5 years time. In 2023 revenue will be $38 Billion and Net Income $7,2 Billion.
At an historical PE of 19, the market cap would be $137 Billion. If, in the meantime, the company buys back let’s say, another $10 Billion worth of shares, at $200 a share, there will be around 527 million shares outstanding.
That amounts to $260 a share which represents a 6,6% CAGR. Throw in a 2,8% dividend yield and we get a 9,4% compound annual growth rate.
5.2. CONCLUSION
This section will be available to paying subscribers in 2019 when we launch the Portfolios. If you’d like to get early-bird conditions, please send us an e-mail.
If you want more, join us at our new Facebook group.
6. DISCLAIMER
The material contained on this web-page is intended for informational purposes only and is neither an offer nor a recommendation to buy or sell any security. We disclaim any liability for loss, damage, cost or other expense which you might incur as a result of any information provided on this website. Always consult with a registered investment advisor or licensed stockbroker before investing. Please read All in Stock full Disclaimer.