One Group Hospitality
a fundamental analysis
Part 2
November, 25 2019
TICKER: STKS
ISIN: US88338K1034
SHARE PRICE: $3,27
MARKET CAP: $97M
November, 25 2019
TICKER: STKS
ISIN: US88338K1034
SHARE PRICE: $3,27
MARKET CAP: $97M
1. INTRODUCTION
I’m constantly looking for good investment ideas. Whenever I stay quiet for a long time, it’s usually because I am studying a company that I believe might be a good investment. That’s how I’ve spent the past few weeks. Looking at the One Group Hospitality.
Now, this stock was brought to my attention by an investor who I hold in high regard. He goes by the name of Houdini in the valueinvestorsclub.com and the fact that he and another investor that goes by the name of Fire_303 got into a very heated discussion led me to learn some valuable lessons.
2. BUSINESS OVERVIEW
2.1. BUSINESS DESCRIPTION
One Group Hospitality, which I will refer to as STKS – it’s ticker and the name of its most famous restaurant brand – is the classic story of a simple business model that could go on compounding for many years, except it didn’t. Not yet, anyway. It now seems that things might change.
Founded in 2004, the One Hospitality Group develops, operates and licenses upscale restaurants around the world.
The company also provides turn-key Food & Beverage (F&B) services. These F&B services include developing, managing and operating restaurants, bars, rooftops, banquets, room service and mini bars for high end hotels and casinos like the W Hotel in LA, the Hippodrome Casino in London and others.
There is currently a trend where hotel developers are separating the hotel management from the Food & Beverage services to increase earnings. STKS is reaping the benefits of such dynamics.
The company’s main brand is STK (think steak), a modern, chic and upbeat steakhouse concept with restaurants that seem more like a nightclub than traditional steakhouses. They call it VIBE dining. Want to see what I’m talking about? Take a look at the pictures below.
And while we’re at it, here’s one of their VIBE dining events in London.
Now, you might argue that this is a fine dining concept, subject to discretionary spending and we’re in the high part of the economic cycle and someday things will change. And you know what? You’re right… but hear me out.
It all started in 2004 with Jonathan Segal, the founder. He enjoyed a good life, he liked going out for dinner so he decided to open a women-oriented steakhouse instead of the traditional one as we’ve seen back there. He opened the first one in the meatpacking district in New York, he then went on to open several other restaurants – some company-owned and some managed or licensed . He grew them too much too quickly which led to poor execution, high debt, low profitability… you get the picture. But unlike other such stories, at some point the board said enough. And Segal agreed.
Enter Emanuel Hilário. This guy in the photo.

“Manny” is a restaurateur with years of experience on his back. He had been working as the CFO of Sizzling Platter, a restaurant-management company operating 400 restaurants in the US and abroad under the brand names of Dunkin Donuts, Little Caesars, Wingstop and others.
They called him to the board in April 2017 and in October of that same year Segal was giving him his place as the CEO. Manny started a total makeover immediately. These were the main goals he outlined from the start:
Number one: driving same-store-sales
Number two: improving operational efficiencies in the restaurants
Number three: reducing G&A (general and administrative expenses) at the corporate level
Number four: focusing on asset light growth
If you listen to the several conference calls Manny has been a part of, you’ll see that the expansion plan was all about that fourth item, licensing restaurants and returning excess cash to the shareholders.
For those of you who are not familiar with the licensing concept, it’s almost the same as franchising but not quite. In a franchise agreement, there is more control and interdependence between both parties whereas in a licensing agreement the licensor won’t be able to exert so much control over the licensee.
This would mean a more capital-light, less risky, higher margin business model. More or less the same strategy as Easterbrook defined for McDonald’s. This way, the company wouldn’t have those initial build-out costs nor the obligation to pay the lease even if one restaurant would perform poorly.
Alongside this, Manny bet heavily on the VIBE concept, opening the restaurants earlier for Happy Hour where they can sell high-margin drinks, then taking the customers to the tables for a high energy dining experience and then offering them a quasi-disco set to end their evenings. This way they are keeping their clients around for longer while selling them pricy drinks.
A lot of these initiatives were laid out in the Q2 2018 Conference Call. Here’s the transcript.
This was all nice and cool, investors were happy waiting to reap the benefits of an early entrance on a capital-light future compounder but Manny turned it all upside down in September 2019 when he bought 25 restaurants from the bankrupt sushi chain Kona Grill.
I will tell you more about Kona Grill in a minute but I suggest we look into the STKS fundamentals first.
Given that I’m writing a lot, here is another video so you don’t get tired. This time it’s a commercial for their “Not Your Daddy’s Steakhouse” campaign.
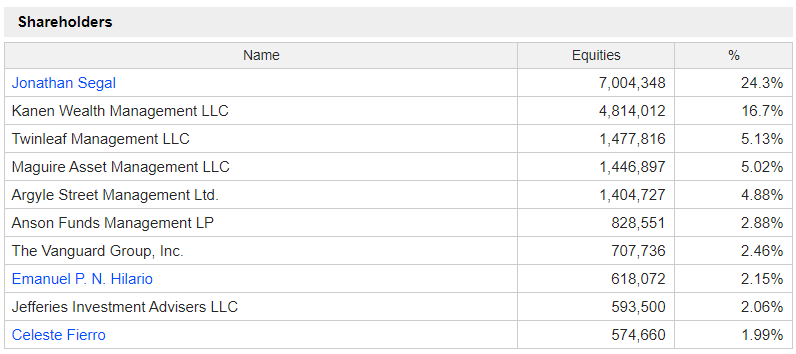
2.2. LARGEST SHAREHOLDERS
Jonathan Segal, the founder is still the largest shareholder with a 24,3% stake.
All the insiders combined own approximately 31% of the company.
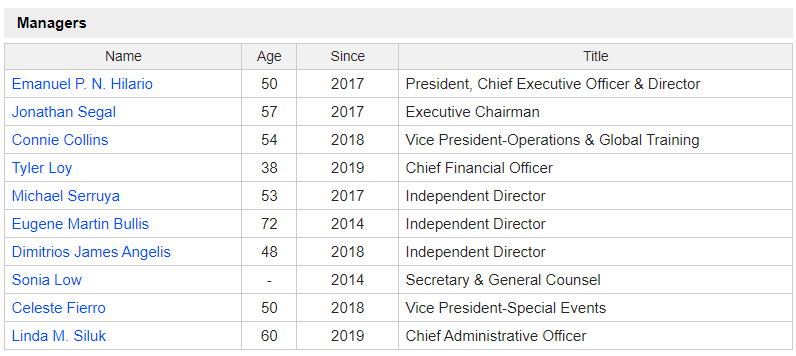
2.3. MANAGEMENT TEAM AND BOARD OF DIRECTORS
Manny heads the management team. There’s a new CFO, Tyler Loy, that he brought in recently. They had worked together in the Einstein Noah Restaurant Group. Then there’s Dimitrios who was nominated by Kanen Wealth Management, the 2nd largest shareholder. With him and Segal there, I think it’s safe to say that the board is well aligned with the shareholders’ interests.
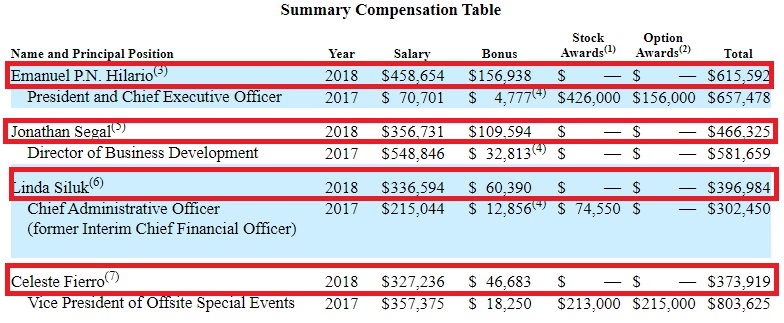
In 2018, Manny earned a total compensation of $615,592 which is about 0,9% of the total revenue. I think this is fairly reasonable.
3. HISTORICAL CONTEXT
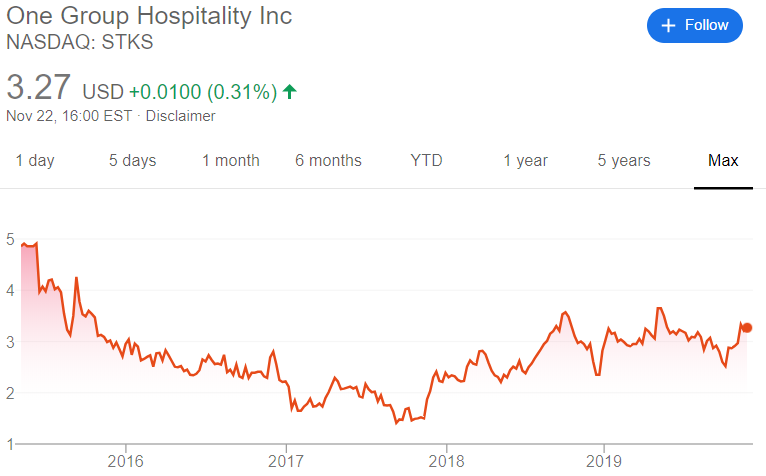
3.1. LONG TERM CHART
The company went public in 2014 at about $5 and the current share price is $3,27.
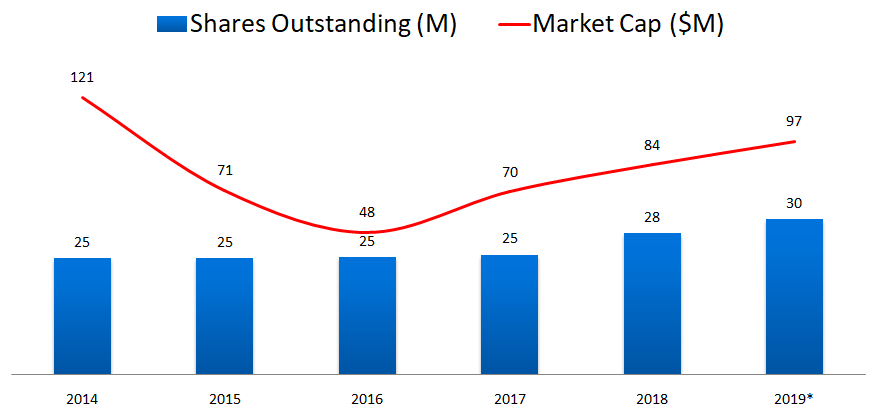
3.2. MARKET CAP AND SHARES OUTSTANDING
The share count has been increasing in recent years. Today the company is being priced by Mr. Market at just shy of $100M.
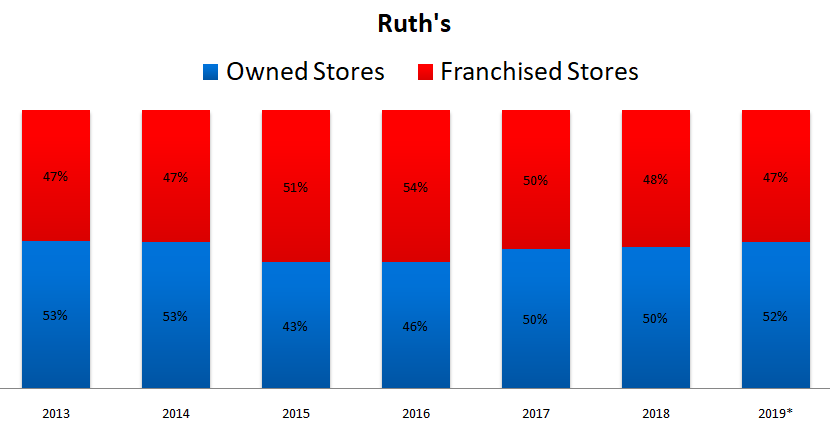
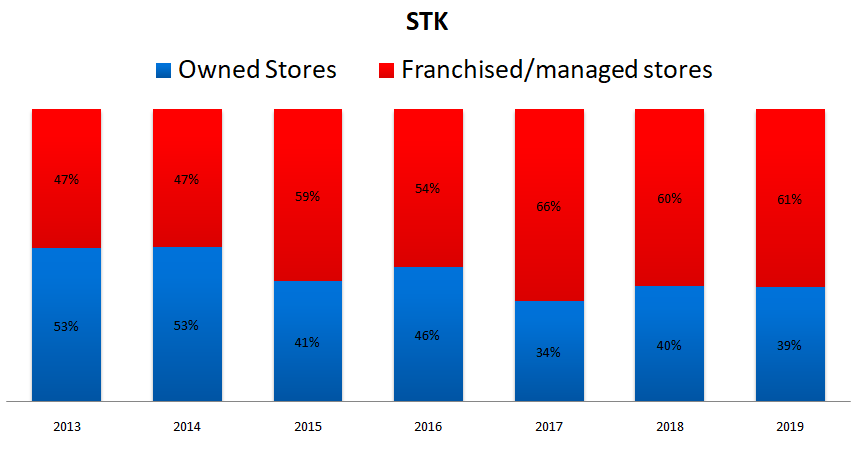
3.3. STORE MIX
I’m introducing Ruth’s Hospitality Group to the analysis as it is probably the most comparable concept in the USA. It’s a much larger company ($681M vs $97M) but I think there are some lessons to be taken by comparing the two.
The first thing I want to know is whether their store mix – company-owned and franchised stores – is similar or if it is materially different.
Ruth has a mix of about 50%/50%. 81 owned restaurants vs 76 franchised or managed.
And surprisingly, STKS has more Franchised/Managed stores than company-owned ones. 11 owned vs 17 franchised or managed.
This alone would lead me to think that STKS’ operating margins should be higher than Ruth’s. We’ll get to that in a minute.
I find it interesting that Ruth’s hasn’t chosen a more capital-light mix after all these years. I should definitely understand why.
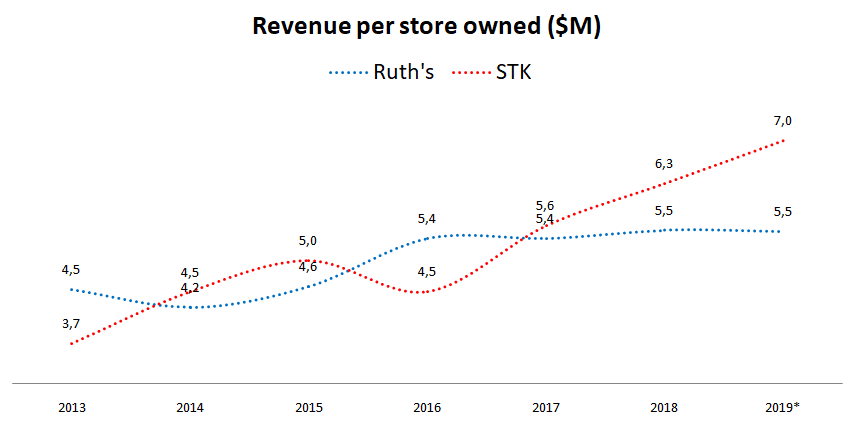
At this stage, we should also get a feeling for the revenue each company-owned restaurant makes.
As we can see, STK’s has been growing its revenue per company-owned store in recent years.
3.4. SALES
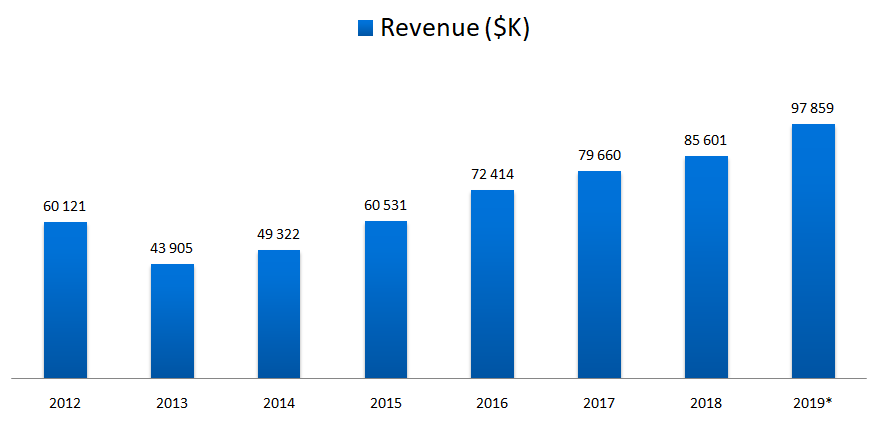
Revenue has been growing nicely for the past 7 years having reached $85,6M in 2018.
Although the latest guidance for the FY2019 revenue was about $120M as a result of the Kona Grill acquisition, I’ve decided not to take that into consideration right now.
3.5. SALES BY SEGMENT
The company makes money in five different ways:
a) from operating its own restaurants
b) from the licensed restaurants where it typically collects a percentage fee of the total revenue
c) from the venues it manages for third parties where it collects a percentage of the total revenue plus incentive fees based on the operating profitability of each restaurant
d) from the licenses it sells to the licensed and managed restaurants
e) from turn key hospitality services, like room services in hotels or banquets.
Let’s now look at the revenue mix from these different segments.
Clearly, the owned restaurants bring in the most revenue.
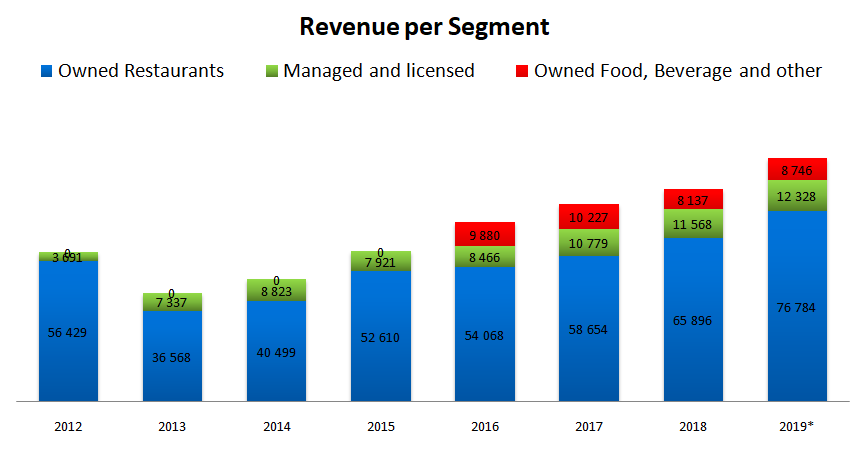
But as in many other restaurant concepts, this doesn’t mean that the owned restaurants are the ones bringing in the most profit.
This happens because the company has a lot of costs operating its own restaurants while it doesn’t have to pay for food or labor or rent when it licenses or manages restaurants, so the revenue coming from these is almost all profit.
As we can see in the chart below, the income from the managed and licensed locations is higher than the income from the company-owned restaurants.
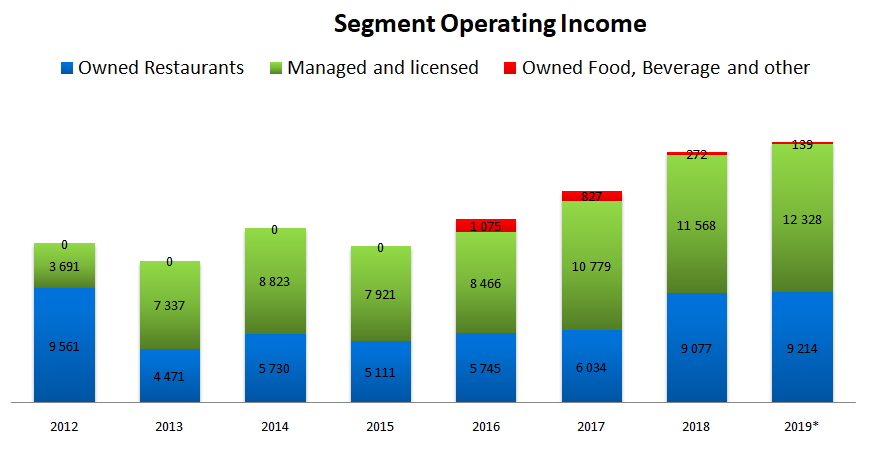
And that’s exactly what Manny wants. These companies usually own and operate a few locations (the best ones) so they can test the concept, fine tune it and then they’ll get scale by licensing or franchising the concept to local operators.
3.6. SAME STORE SALES
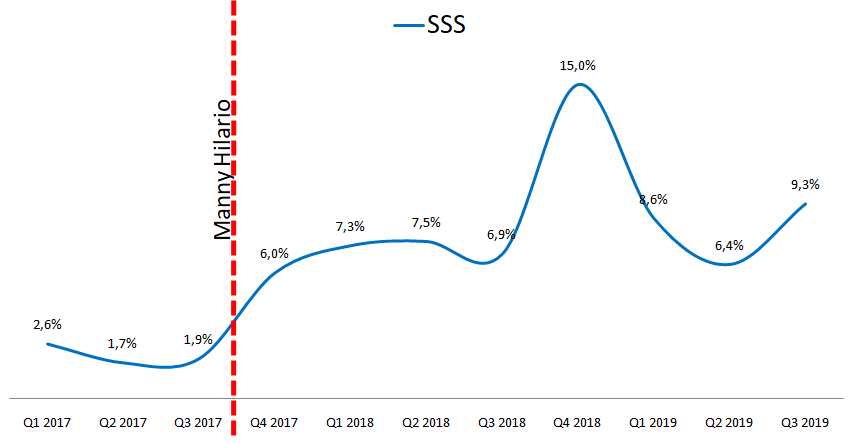
Since we’re talking about a food retail business, we should be looking at the same-store-sales (aka comparables or comps). As we can see, ever since Manny Hilario got on board, the same-store-sales have been rising.
In the third quarter of 2019, they’ve reached the very sound level of 9,3%. There’s not a lot of restaurants getting such great comps. As a means of comparison, Ruth’s same-store sales for the third quarter increased 0,5% from the prior year.
This is due to those initiatives like increasing the time the restaurants are open, focusing on the drinks business, happy hour and late night.
This is one of the reasons for the discussion in valueinvestorsclub. The fact that Manny Hilario has changed the way the Same-Store-Sales are calculated several times since he got on board.
For instance, prior to his arrival, the foreign restaurants were included, but now only the US restaurants are accounted for so the comparison we are seeing here might be somewhat skewed in favour of the company.
I think that’s a valid argument but it doesn’t hide the fact that these comps are really sound and that Manny Hilario has been doing things right.
Another argument against Manny is that he has been able to grow SSS by keeping the restaurants open for longer and these “new hours” have lower margins (by keeping the restaurants open with the same operating costs that at peak time but with fewer customers). That might be true, but does it mean it’s a bad strategy?
Should a restaurant owner reject cash coming in the door because it has a lower margin? I’m not sure if there’s a right and a wrong answer to this. On the one side, the margins are lower, on the other side these people will usually stay for dinner and spend more money at higher margins so…
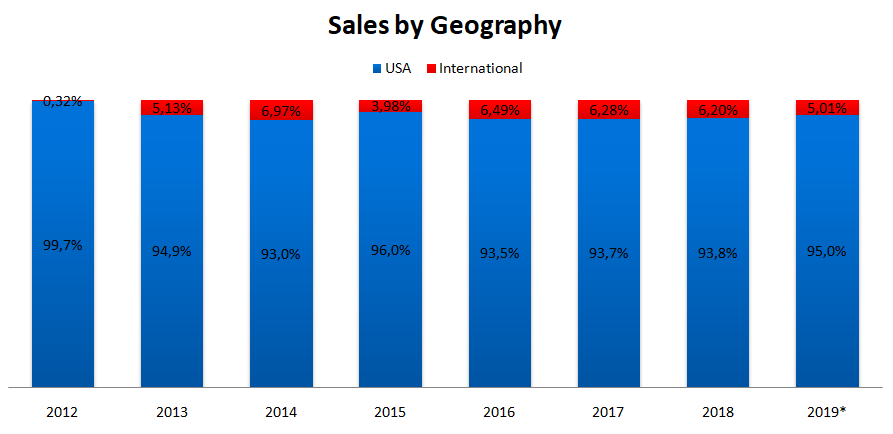
3.7. SALES BY GEOGRAPHY
Clearly most of the sales come from the USA where most of its owned-locations are.
3.8. OPERATING METRICS BREAKDOWN
Let’s now take a good look at the costs structure for both concepts so we can better understand them.
Let’s start by the Cost of Goods Sold. This can tell us a lot about the pricing power of a given restaurant.
As we can see, Ruth’s cost-of-goods-sold as a percentage of revenue is higher than STKS’, which means that its gross margin is lower which in turn means one of three things: a) it buys food and drinks at higher prices (which I doubt because it’s a much larger company); b) it isn’t able to sell food and drinks at the same prices as STKS’ and c) the mix between food and drinks is different from STKS’.
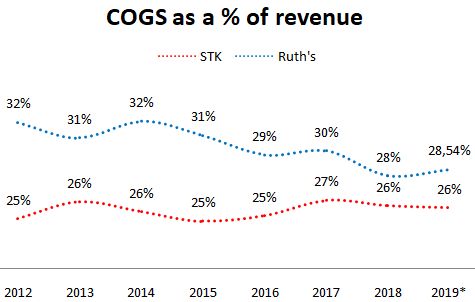
I would bet on b) and c) as the right answers.
Ruth’s restaurants are “old fashioned” steakhouses. STKS’ restaurants are more like clubs where people like to drink and have fun. As we’ve already seen, the bar part of the business is very important, so by selling more drinks – which have higher margins than the food – STKS is able to get a higher gross margin.
Due to the lower beverage percentage in Ruth’s restaurants (25% vs 34%), its gross margin is more affected by the beef price variation. STK’s beef costs as a percentage of COGS was 35% in 2018 (33% in 2017) whereas Ruth’s beef cost was around 45% in 2017. This might seem like a detail, but it’s very important. Beef costs are much more volatile than liquor’s. If the company is able to reduce its weight, the gross profit will be much more stable and predictable.
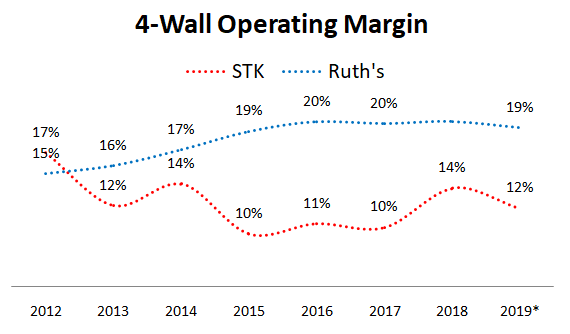
When people refer to any 4-wall metric, they are talking about what happens inside the restaurants, without accounting for the corporate operations.
So, the 4-wall operating expenses in the chart below are telling us a different story from the COGS. Ruth’s runs a much leaner operation than STK. There’s a 9% difference.
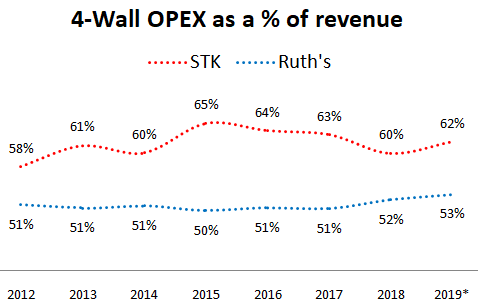
This is such a stark difference that I had to double-check what each company includes in its 4-wall expenses (some adjustments had to be made in order to compare apples to apples). Usually these include labor, occupancy and advertising costs as well as other operating costs like dry-cleaning, silverware, etc.
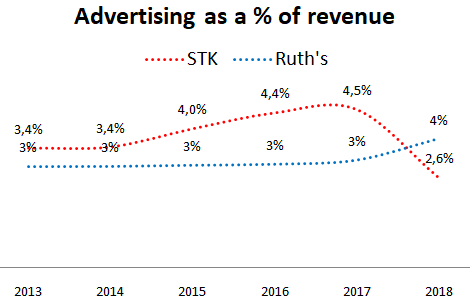
To give you an example of the work Manny has been doing, the advertising costs went from 4,5% of revenue to 2,6%.
As we’ve seen, on average, the cost-of-goods sold is about 30% of the revenue while the 4-wall operating expenses are in between 50% and 65%. This means that the 4-wall profit margin is somewhere between 10% and 20%.
All of these combined make Ruth’s 4-wall EBIT margin considerably higher (and more stable).
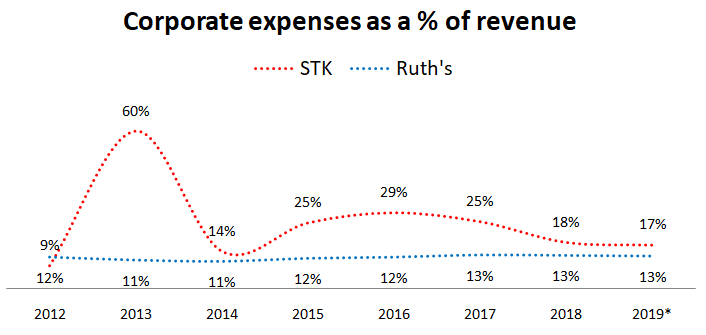
Let’s now look at the corporate level.
The corporate expenses went down from 25% in 2017 to an estimated 17% in 2019.
Manny has been able to do this by taking several cost-cutting measures like cutting corporate overhead or taking the company’s headquarters from the expensive New York City to the cheaper Denver.
Ruth’s corporate expenses haven’t changed much in the last 8 years.
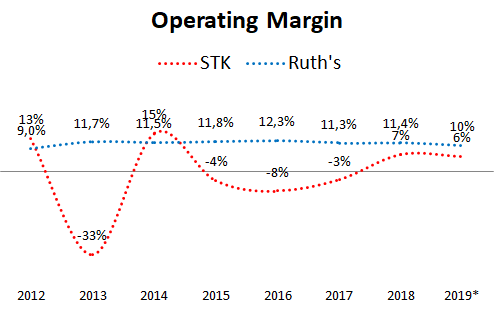
Comparing both operating margins, we see that my assumption that STKS should have a higher operating margin was wrong. Ruth’s operating margin has gone from the mid single digits in 2009 to the low double digits now, while STKS stands around 7%.
You can look at it in two different ways. STKS is worse at keeping its costs down or STKS still has a lot of room for improvement. Both are correct.
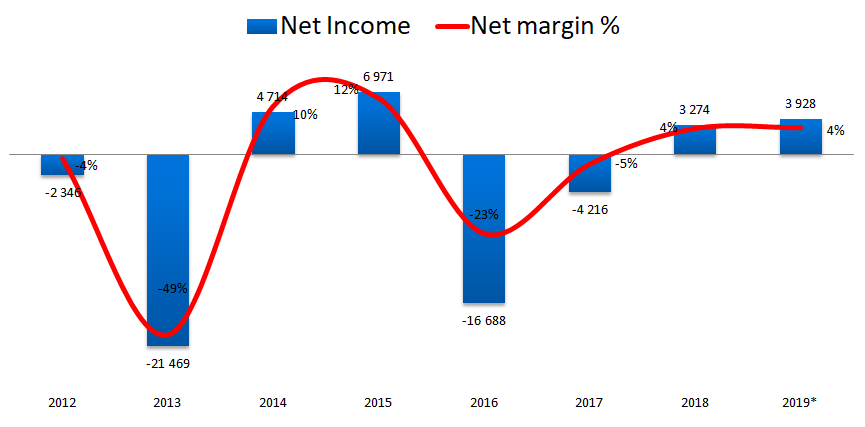
3.9. NET INCOME
As expected after looking at the operating margin, the net income has been quite erratic too. The profits expected for 2019 are $3,9B, for a 4% margin (excluding the Kona Grill acquisition).
3.10. EFFICIENCY METRICS
My friend Rupam Deb from MoneyWiseSmart.com told me the other day that I should spend more time looking at the balance sheet. I agree with him.
In a business like this, operational efficiency is paramount, so let’s take a look at some ratios.
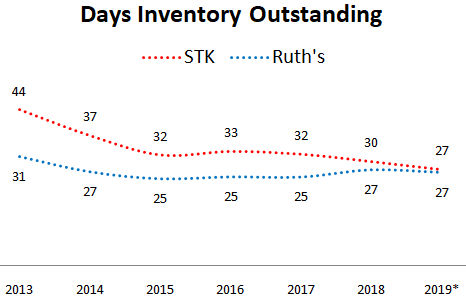
The first one I’m looking at is the Days-Inventory-Outstanding, that tell us – on average – how long the company takes to sell its inventory. As a rule of thumb, the lower the better.
STK has been steadily reducing its inventory days and is now neck to neck with Ruth’s. It takes both of them 27 days – on average – to sell their inventory.
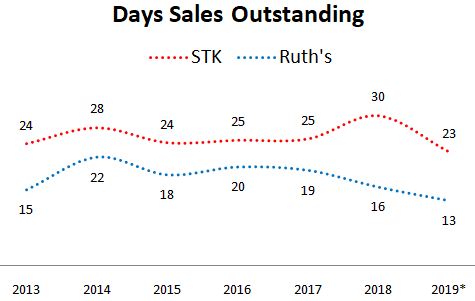
Next I’ll want to look at the Days-Sale-Outstanding. This tells us how long it takes for the company to collect it’s receivables. In theory, if people pay right away when they visit these restaurants, there shouldn’t be meaningful receivables.
But it seems I was wrong in my assumptions. As we can see Ruth’s collects its receivables – on average – after 13 days while STKS’ does it in 23 days.
I’m not sure how comparable these are given that both companies operate in slightly different ways. For instance, in STKS’ numbers there are receivables from the management agreements they have, so I think we’ll never see these getting closer.
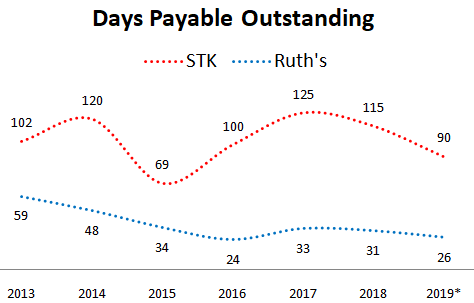
And now, we’ll want to look at the Days-Payable-Outstanding or how long it takes each company to pay its suppliers.
This one actually surprised me.
STKS takes about 90 days to pay its suppliers while Ruth’s takes 26 days. I’m not sure why this happens given that Ruth’s is much larger than STK and as such, should have higher bargaining power.
Maybe this is also related to differences in the operating models. Until I understand these better, I’ll take them with a grain of salt.
All of this (together with considerable deferred revenue coming from Ruth’s gift cards) leads to negative cash conversion cycles for both companies.
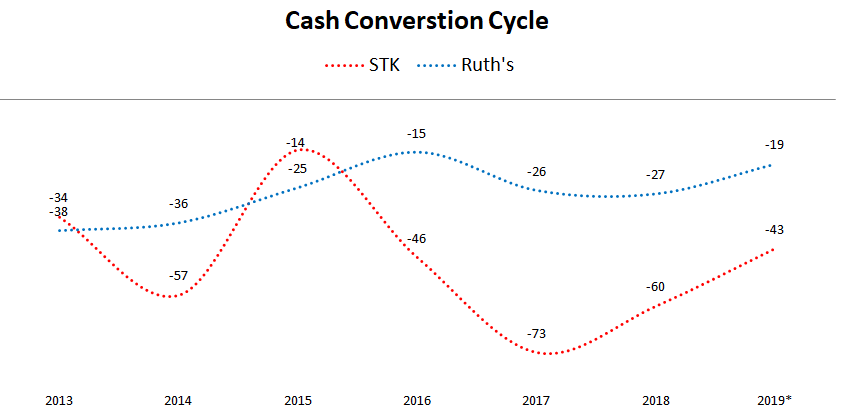
What does this mean?
First of all, the Cash Conversion Cycle expresses the time it takes for a company to collect from its customers after it has paid its suppliers.
If you look at the picture below, you’ll see a “normal” operating cycle where a company pays for its supplies well before collecting from its customers.
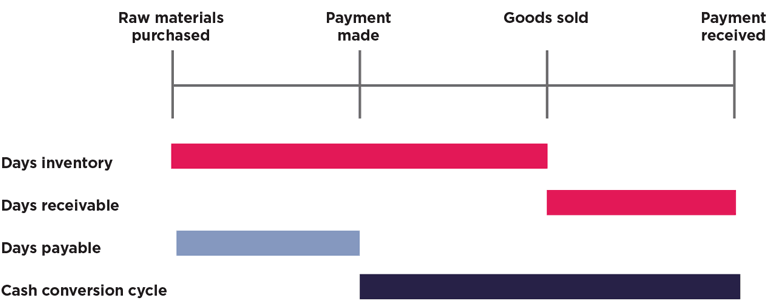
But in the case of both STKS and Ruth’s, the “Payment made” happens after the “Payment received”, so this means they are both negative working-capital businesses.
In the second part of this analysis I will be looking deeper into STKS’ financials, the acquisition of Kona Grill and I’ll create a downside scenario so we can understand how this business would fare in a recession. Stay tuned…
In the meantime, you can join our community at our:
DISCLAIMER
The material contained on this web-page is intended for informational purposes only and is neither an offer nor a recommendation to buy or sell any security. We disclaim any liability for loss, damage, cost or other expense which you might incur as a result of any information provided on this website. Always consult with a registered investment advisor or licensed stockbroker before investing. Please read All in Stock full Disclaimer.
Warning: Undefined array key "cat" in /home5/manuelbean/public_html/wp-content/plugins/recent-posts-widget-extended/classes/class-rpwe-widget.php on line 176
Warning: Undefined array key "tag" in /home5/manuelbean/public_html/wp-content/plugins/recent-posts-widget-extended/classes/class-rpwe-widget.php on line 177
Warning: Undefined array key "css_id" in /home5/manuelbean/public_html/wp-content/plugins/recent-posts-widget-extended/classes/class-rpwe-widget.php on line 200
Deprecated: preg_replace(): Passing null to parameter #3 ($subject) of type array|string is deprecated in /home5/manuelbean/public_html/wp-includes/formatting.php on line 2431
Recent
[the_ad id="17156"]