Ryman
vs
Summerset
You can find the 1st part of this series HERE.
By Manuel Maurício
June 19, 2020
Summary
Earlier this week, I’ve had a call with Michelle, Head of Investors Relations at Ryman Healthcare, so she could help me understand the intricacies of the business.
Happy call about old people and accounting
Ryman Healthcare and Summerset Group Holdings are the two leading retirement villages operators in New Zealand and both share the same business model. Ryman is the market leader while Summerset is doing everything to follow its steps.
This is a brilliant business model that allows these companies to generate high returns on shareholders equity. The elderly care business doesn’t actually generate that much cash. For Summerset, it’s even a loss making division, but the real estate side of it more than makes up for the difference.
In this write-up I’m doing a head-to-head comparison between both companies. My feeling so far is that Ryman is a superior business, but it will take me more time and study to understand all the moving parts. In order to achieve this, I’m waiting to speak to Scott Scoullar, Summerset’s CEO, and with the leading industry expert Arie Dekker.
In the meantime, here’s what I’ve learned so far:
Company: Ryman Healthcare
Symbol: RYM (New Zealand Stock Exchange)
Share Price: NZ$13,50
Market Cap: NZ$6,4 Billion
Ryman Share Price History
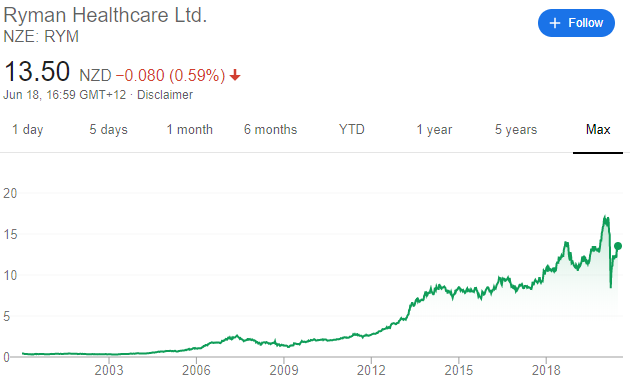
Source: Google
Company: Summerset Group Holdings
Symbol: SUM (New Zealand Stock Exchange)
Share Price: NZ$6,40
Market Cap: NZ$1,5 Billion
Summerset Share Price History
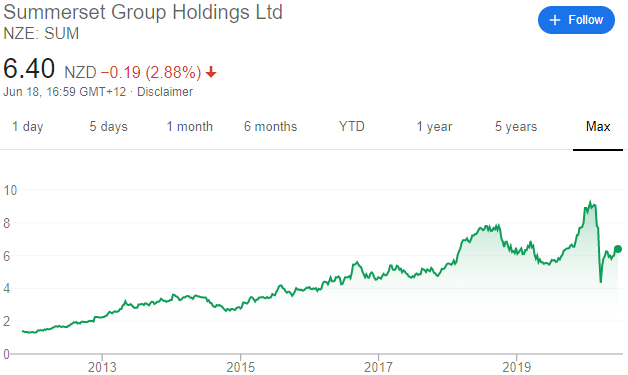
Source: Google
Comparison
When I’m doing a head to head comparison between two companies, I like to start by checking their size relative to each other. At NZ$6,4 Billion, Ryman Healthcare is worth 4 times what Summerset is worth.
Market Cap
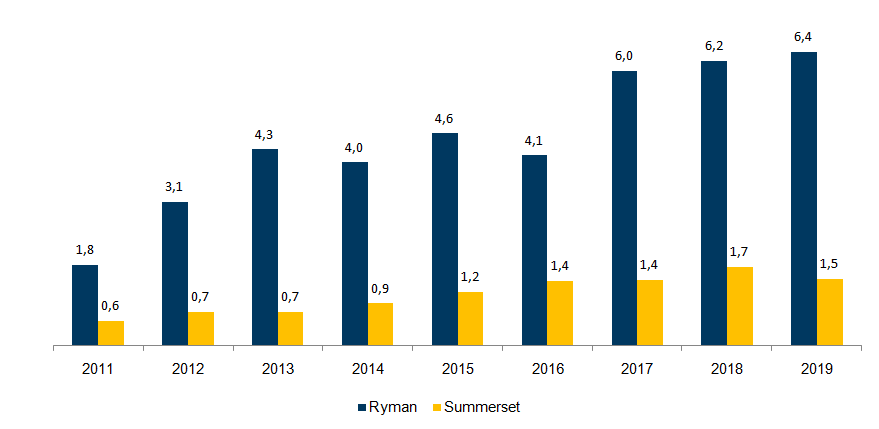
Source: Company filings
But if we look at the total revenue for both companies, we can clearly see that Ryman doesn’t even reach double the sales.
Total Revenue (including unrealised gains)
Source: Company filings
You might’ve noticed that the revenue for both companies has been declining in recent years. This happens because this revenue includes something called “unrealised gains on the Investment Property” which doesn’t really represent cash coming in or out of the company. You see, up until 2018, the housing market in Auckland was experiencing a boom. Some even talked about a bubble. Since then, prices have dropped hard (+20%). So the value of these companies’ assets have also taken a hit.
To get a better reading of the operations, we can instead look at the Operating Revenue. When we exclude the unrealised gains, we see a beautiful chart. It seems as if it won’t ever go down.
Operating Revenue (excluding unrealised gains)
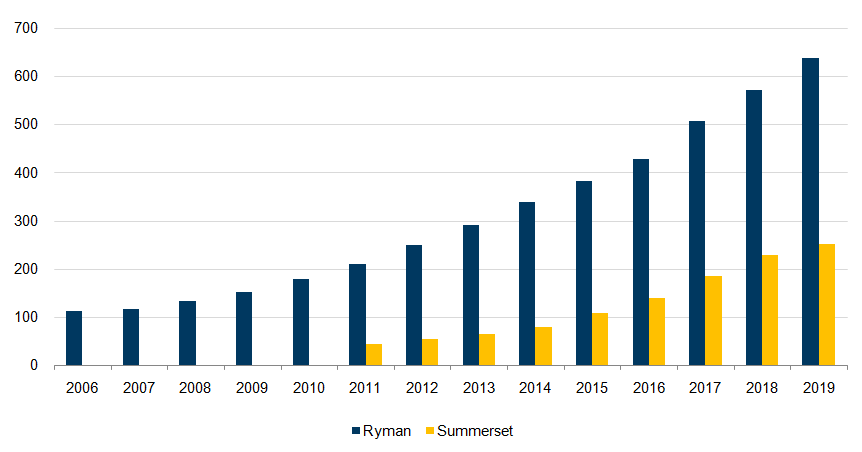
Source: Company filings
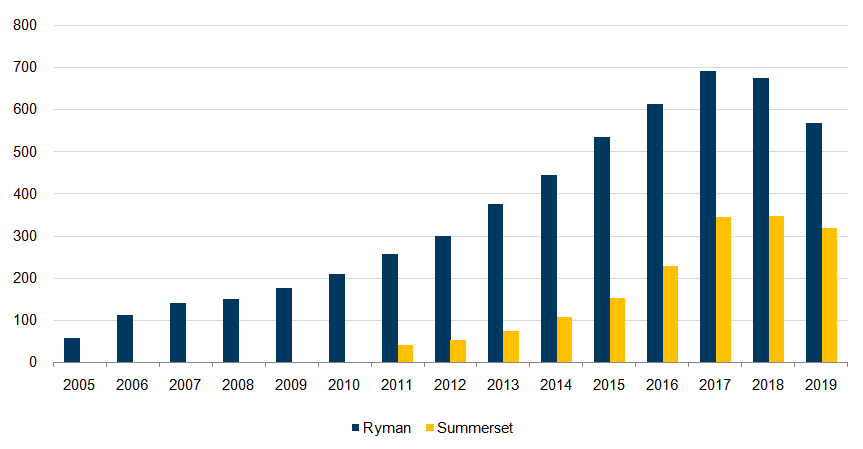
Now, looking at the underlying profits of both businesses (excluding the unrealised value of the property), Ryman is more than twice as profitable as Summerset.
Underlying Profits
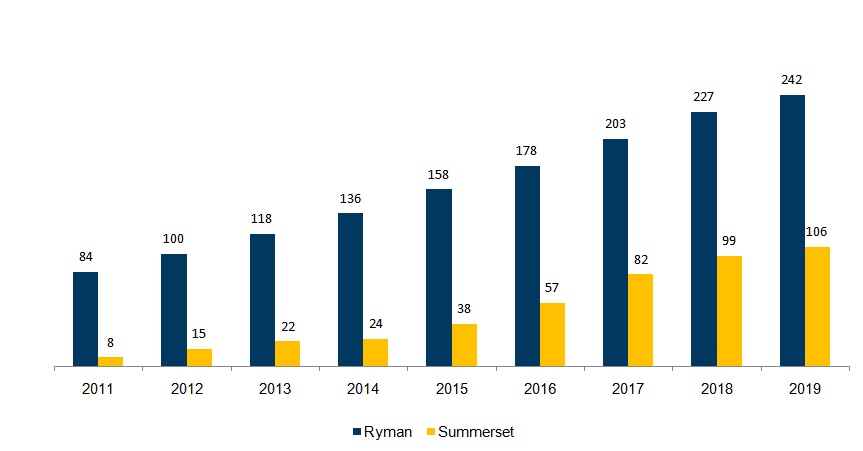
Source: Company filings
If Ryman’s market cap is 4 times that of Summerset and its profits are just slightly double, we can safely say that Ryman is valued at roughly twice the multiple of Summerset.
Price to Underlying Profits
Source: Company filings, AiS estimates
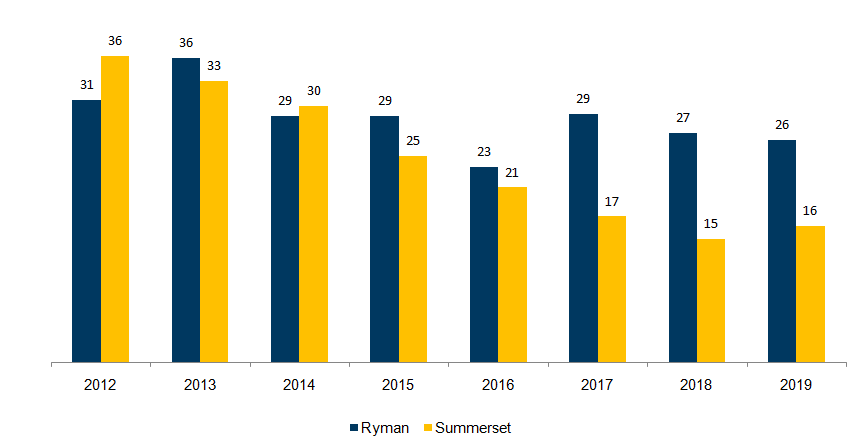
Not quite, but almost. Ryman is trading for a PE multiple of 26, while Summerset is trading for a much more modest 16.
If we stretch this all the way back to 2006, we’ll see that Ryman was once very cheap on a PE basis. I wonder if we’ll see such a multiple expansion for Summerset going forward.
Price to Underlying Profits
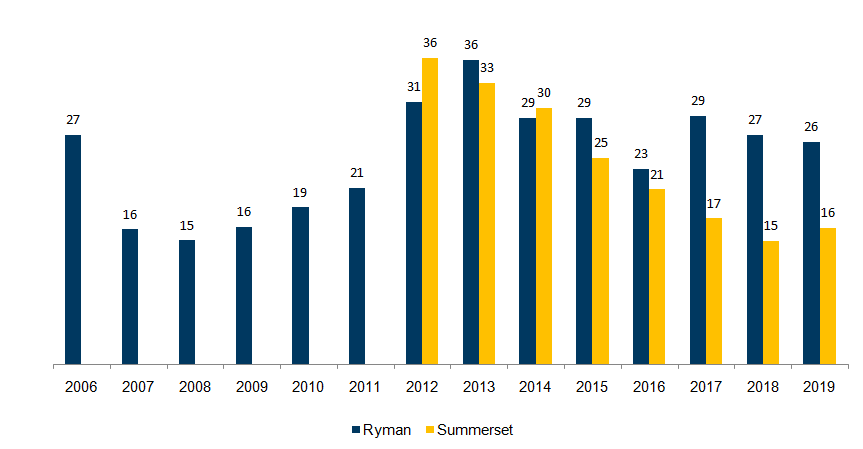
Source: Company filings, AiS estimates
Clearly, the market favours Ryman over Summerset. BUT, if you invested in both companies at the time of Summerset’s IPO, back in 2012, you would’ve enjoyed similar returns. That’s because Summerset has grown its underlying profit at a staggering 38% annually while Ryman has done it at 15%.
Return on Equity
On my previous write-up I’ve said that the returns on invested capital for these businesses were great, but I didn’t present evidence to back my claim. You see, although it’s easy to see the signs indicating a high Return-on-Invested-Capital, it’s not easy to actually find the value of the equity at cost because these businesses follow unconventional accounting rules. Fortunately Ryman gives us the historical “equity at cost”.
Ryman: Return on Equity (at cost)
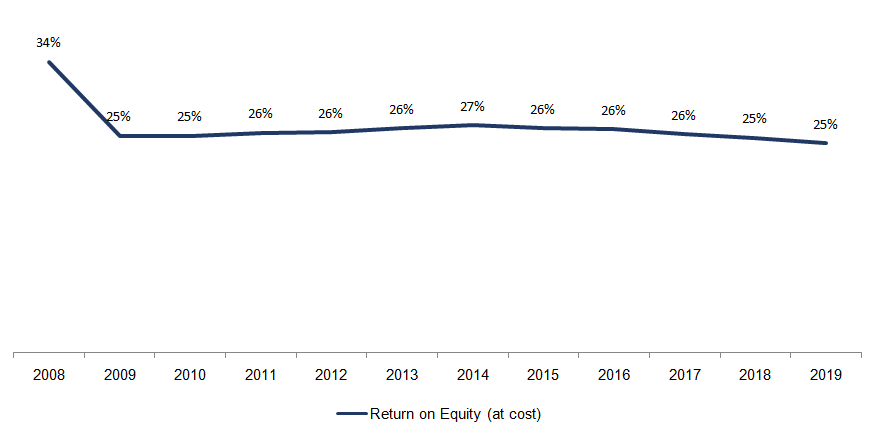
Source: Company filings
If the company distributes half of these 25% as dividends and retains the other half and keeps getting the same returns, the company will likely grow at 12,5% in the future. Unfortunately I’m still waiting for an email from Summerset in order to calculate its Return-on-Equity at cost.
Real Estate
If you’re looking for a retirement village to spend the rest of your days in, you’ll surely be looking for one that guarantees you’ll have a care bed or an hospital available when the time comes. And in that front, Ryman clearly takes the lead.
Proportion of ILU to Care Beds
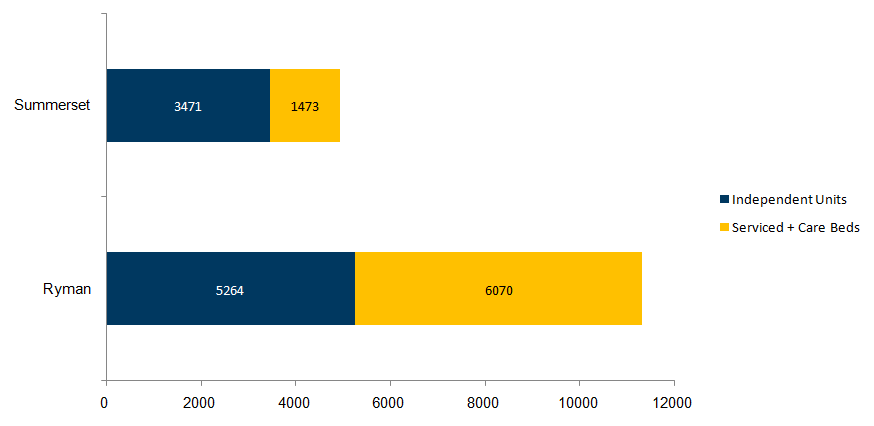
Source: Company filings
With more service apartments and care beds than Independent Living Units, Ryman’s residents can be sure that they will get the care they need. In fact, Ryman builds more care beds than it needs to in order to serve the surrounding communities. And its residents will benefit from priority access to them. This is clearly a major advantage over Summerset.
And that’s why Summerset is growing its landbank to have a higher proportion of care beds and serviced apartment than today.
Landbank Composition
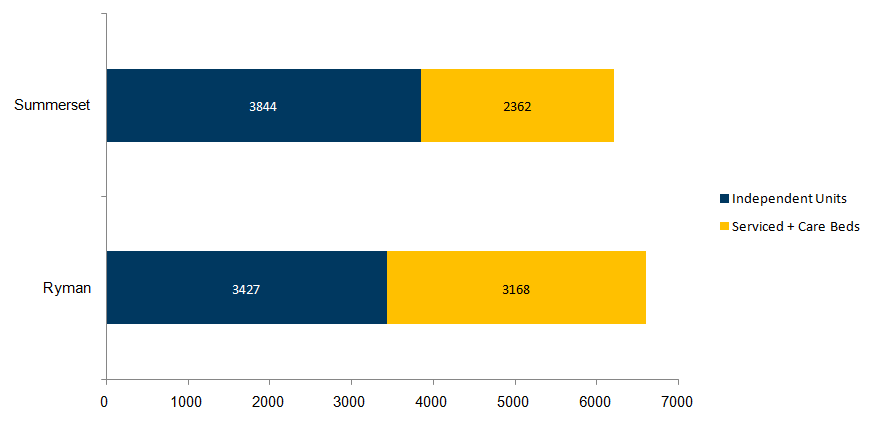
Source: Company filings
As we’ve seen in the previous write-up, these companies growth is tightly linked to their asset base. That’s why having a strong landbank is important. Summerset has always lagged Ryman, but in 2019 it has massively increased the size of its landbank.
Land Bank
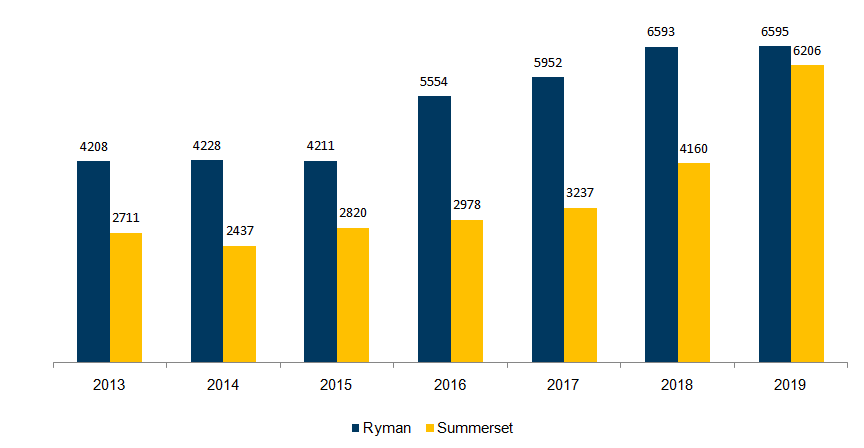
Source: Company filings
Looking at the build rate, Ryman has been able to consistently build more units and beds than Summerset. At a normalized build rate, Ryman’s landbank covers 7,3 years and Summerset’s landbank covers 12 years.
Build Rate
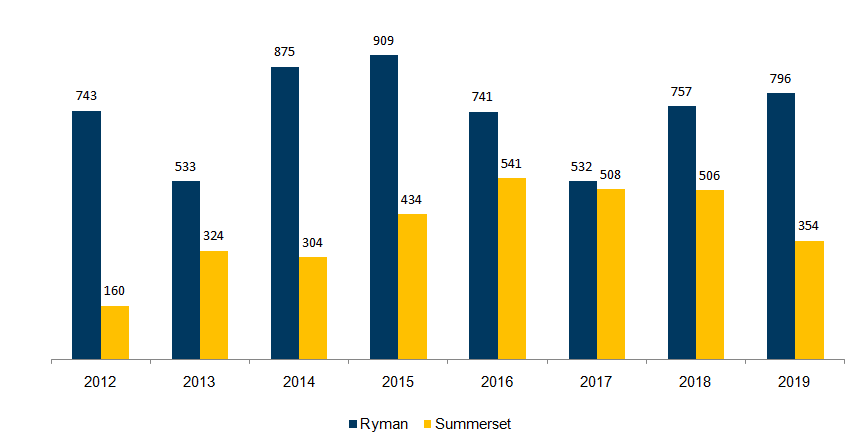
Source: Company filings
Fees
While Ryman Healthcare charges a Deferred Management Fee (DMF) of 4% per year of the ORA (Occupancy Rights Agreement), capped at 20%, Summerset charges 5% capped at 25%. Other competitors may charge up to 10% capped at 30% of the ORA amount.
Regarding the weekly-fees, Michelle has been kind enough to explain that they’re bundled together with the care-fees. The average weekly fee is $129 if you’re living in an independent unit whereas if you’re living in a serviced apartment, it will go up to $350. I believe that the standard fee for Summerset is $110.
Then, there’s all sorts of fees when you move from an independent unit to a serviced apartment. You can have your breakfast in bed, someone to switch the tv channel for you, someone to give you a bath, etc.
I’m still not sure about what the DMF and the weekly-fee cover and Michelle wasn’t quite clear in explaining it. Supposedly the DMF pays for the right to use the common areas and the refurbishment of your unit after you leave while the weekly fee is charged for using the Spa, Gym, Salon, Theatre, etc.
Fees as % of revenue
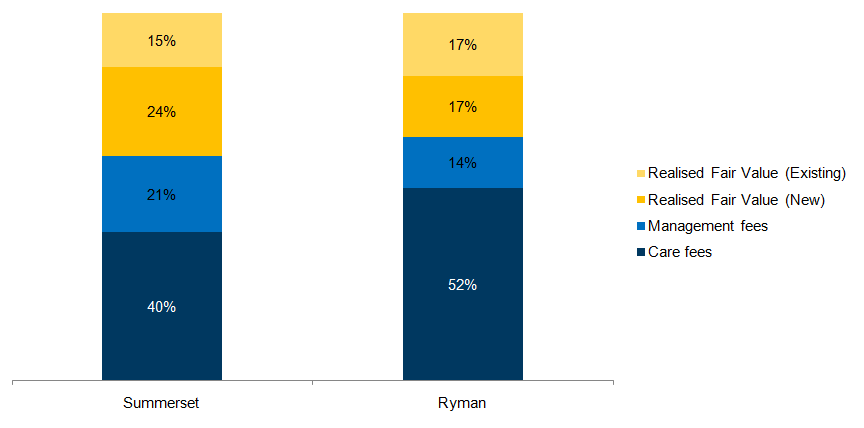
Source: Company filings
The fact that Ryman has a larger proportion of care beds leads to a more defensive source of revenues. While Ryman is able to cover 90% of its costs with the care fees, for Summerset that ratio drops to 73%. That means that in the case of an economic downturn, Ryman should be better protected against a drop in the management fees that are derived from the sale of ORA’s.
Cost Coverage by Care Fees
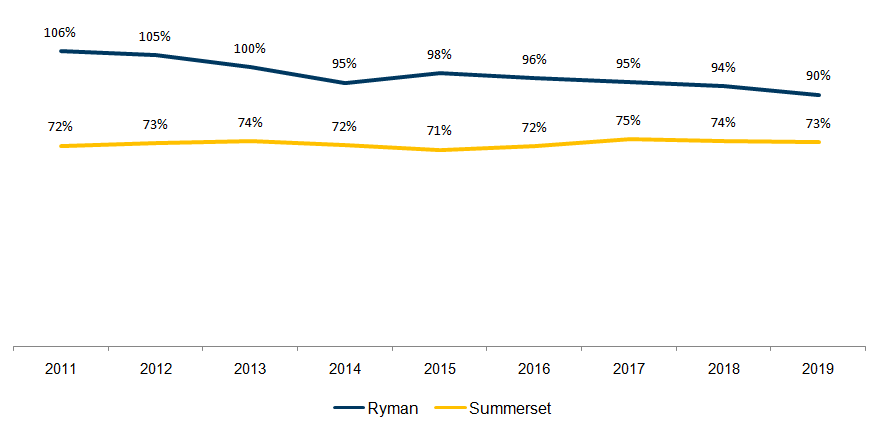
Source: Company filings, AiS estimates
Together, the care fees and the deferred management fees cover all the costs. This means that the true way these companies make money is by selling the ORA’s to the residents. These are real estate companies who uses the care service as bait.
No Taxes
Another surprise from my conversation with Michelle is that these companies don’t pay any capital gains tax. Why? It seems to me like a tax code loophole that they’ve been smart enough to exploit and Michelle mentioned that the tax code has recently been revised and it will stay the same. In effect, these are Public-Private Partnerships where the state – instead of financing the construction and build out of the care facilities – just gives this companies a tax exemption. As in many other countries around the world, the NZ public hospitals are not in the best shape nor are they enough to handle the demand. That’s where these private companies come in. They are effectively “helping” the state. Although I have no basis to believe that the tax code might change anytime soon, this would be something to watch out for.
Development
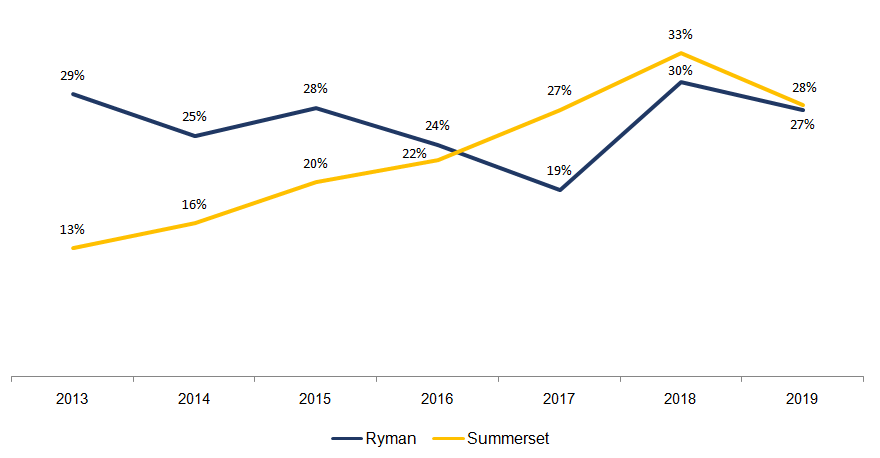
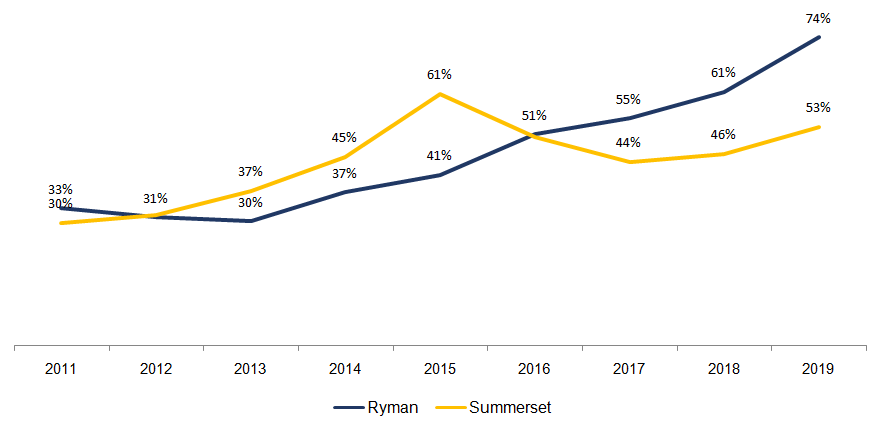
Let’s now turn to the development side of these businesses. As a less mature business, Summerset has been increasing its development margin (the difference between the sale price and the construction cost). Both companies target a development margin in the range of 20% to 25%.
This means that the initial sale of the ORA is enough to pay for the whole development and construction of the villages (living units + communal areas + care facilities).
Development Margin
Source: Company filings
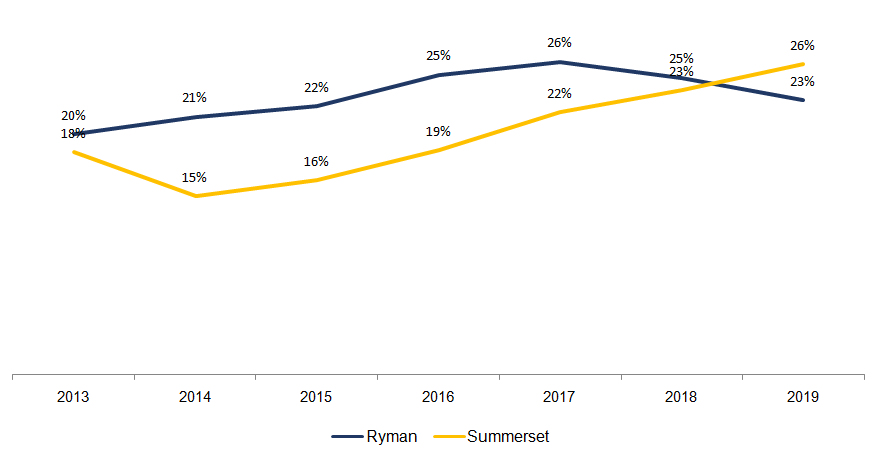
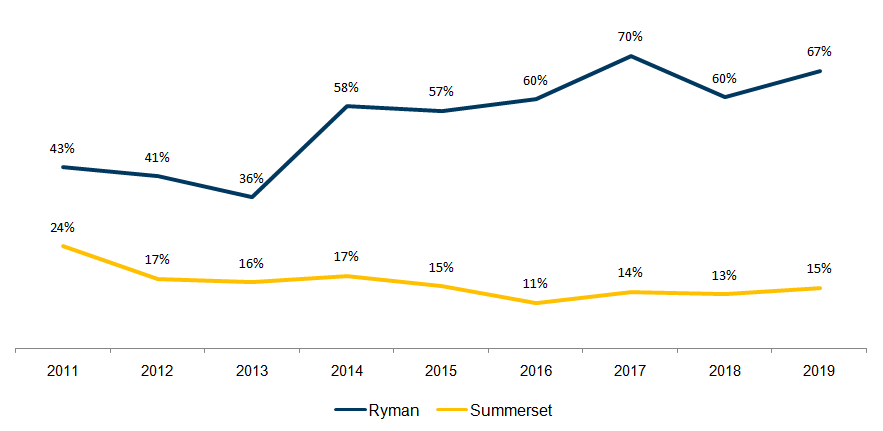
After the first cycle (7 years), both companies will resell their units again to new residents, and that’s really when the company starts making money . The resale margin (the difference to the price the previous resident had paid for his ORA) has been similar for both, around the mid-twenties in recent years.
Resale Margin
Source: Company filings
Cash Flows
Now comes the time when things start to get cloudy. I would like to understand the cash these businesses would be able to generate on a steady state scenario (no growth). For that, I would need to understand the cash that each segment generates as well as the maintenance Capex. Unfortunately, none of the companies discloses the maintenance Capex and both make it very hard to understand what is Core Cash Flow and what is Development Cash Flow. Fortunately I was able to get some help from Arie Dekker.
Summerset loses money on the care business. It relies solely on the resale of the ORA’s to be able to generate cash on a steady-state.
It has recorded $28M in Core Operating Cash Flow (excluding sales of new ORA’s) while its interest expense was $24M. This doesn’t even account for maintenance Capex and the $19,5M cash dividend. Every 4th grader can do the math. If the core business is generating 28 and there are outflows of 24 + 19.5, this means that the company is funding its dividend with debt. And this is a no-no.
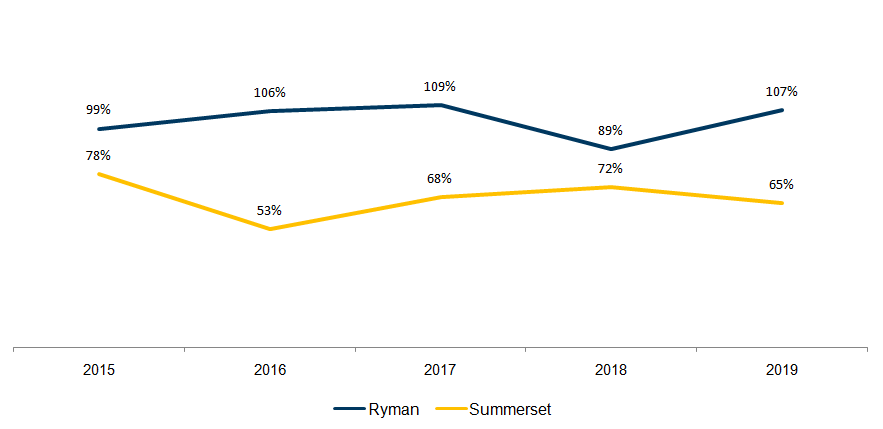
Ryman, on the other hand, is able to fund its interest payments and dividend from the core operations. It’s able to do so because it doesn’t lose money on its care business, result of the larger number of care beds proportionally to the number independent living units.
Core Operating Cash Flow/ Interest + Dividend
Source: Company data, AiS estimates
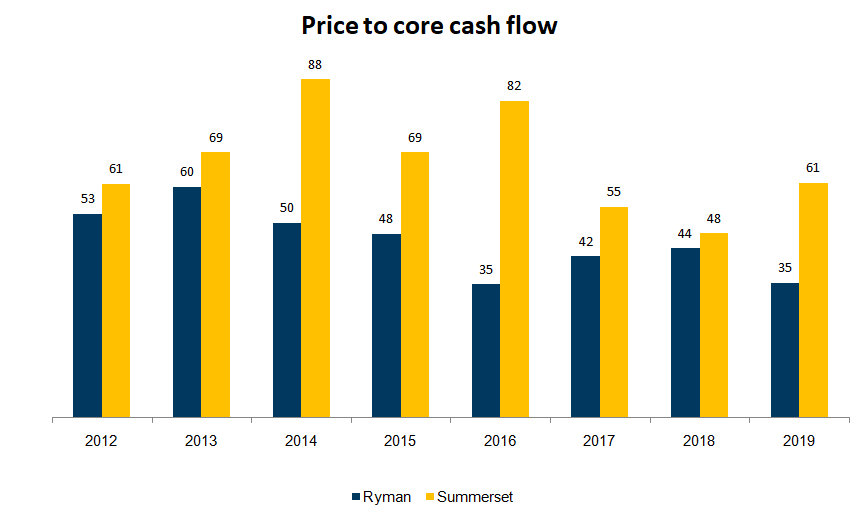
Let’s now recalculate the valuation for each of these companies by looking at the Core Operating Cash Flow instead of the Underlying Profits. We can see that Summerset has always been more expensive than Ryman. The market isn’t dumb. Hey. Did I just say that?
Price to Core Operating Cash Flow
Source: Company data, AiS estimates
Balance Sheet
The fact that both Ryman and Summerset don’t disclose their bank funding terms makes it difficult for investors to really understand the potential downside for these companies. Having a perspective on how the lenders look at the risk in these companies would be interesting.
The traditional interest coverage ratios don’t really apply here given the “untrue” character of the Income Statement. We don’t even know the maturities of the debt. The company says that, on average, the debt matures in three years, but that isn’t enough.
Debt to Equity
Source: Company Filings
What we see in this chart is a recent spike in the debt to equity, especially for Ryman. This is due to the fact that the equity hasn’t been growing at the same rate as the debt, which in turn is caused by the lower valuation of its Investment Property.
The industry uses Debt-to-Equity ratios on presentations, but the banks are obviously looking at this on a Cash Flow basis. But which cash flow? The one generated by the core operations or the one by the development operations?
And if all of these accounting rules weren’t enough, the fact that Ryman follows a different revenue recognition policy (it recognizes the sales of the ORA’s in advance) makes it hard to compare the receivables, which have been growing. The Accounts Receivable outpacing Revenue is usually a red flag. It might mean that the company isn’t able to collect from its clients. I’m still not sure how to look at this.
Accounts Receivable as % of Revenue (excl. unrealised gains)
Source: Company Filings
Another interesting quirk about Ryman is that it doesn’t hold cash on the balance sheet. This happens because it has an agreement with the bank that at the end of the year the bank should withdraw almost all of the cash to pay down debt. Hummm…
Risks and Conclusion
Given that we’re looking at hybrid companies, at first it wasn’t easy for me to understand what makes the wheel go round. I finally got it. It’s the ability for these companies to keep selling the ORA’s at increasing prices. If that stops, everything else stops. So the big questions we face are a) How can the wheel stop, or at least slow down? b) How likely is this to happen?
Several factors come into play if we want to answer this question:
1) Increased competition might force them to lower the prices. This doesn’t seem likely for Ryman given that its competitors are all more expensive with less attractive facilities. Ryman is the low cost producer and has the best product.
2) Another way for the ORA prices to be impacted would be if the housing market in New Zealand (and to a lower extent in Australia) suffer. We’ve seen that they have already been correcting. Can they correct further? With this virus still around, there’s no doubt that prices can come down even more.
3) One other major risk lurking out right now it the possibility for a widespread infection in one of its villages. If this happens and several people die, these companies will have to pay a lot of ORA’s back to the heirs. Add to this the fact that less people will want to move in because a lot of people is dying. You see how this can get tricky quickly, right? Now, one thing is certain. The more villages a company has, the lower the risk of one single village affecting the rest of the business and in a matter of months people would forget about it. Having said that, NZ has had very few cases. It helps being an island far away from just about anything.
As I’ve said at the beginning of this write-up, Ryman seems to be the best company between the two, but there are several things I still need to understand before making an investment in any of these companies. I will keep you posted as I go along.
DISCLAIMER
The material contained on this web-page is intended for informational purposes only and is neither an offer nor a recommendation to buy or sell any security. We disclaim any liability for loss, damage, cost or other expense which you might incur as a result of any information provided on this website. Always consult with a registered investment advisor or licensed stockbroker before investing. Please read All in Stock full Disclaimer.