The Joint,
a fundamental analysis!
March 15, 2019
SHARE PRICE: €14,5
MARKET CAP: €199,27B
1. INTRODUCTION
I know “The Joint” quite well because I bought it when it was selling at around $7 and sold it at $8 because I figured it would take time to see the share price go up and I thought I could make a quick buck elsewhere and then come back again before the price went anywhere.
This happened two months ago and the stock price is now $14,5. This my friends, is the perfect example of how market timing and a bad reasoning can have tremendous influence on the outcome of your investments. Lesson learned.
2. BUSINESS OVERVIEW
2.1. COMPANY PRESENTATION
The Joint Corp. is an american franchisor and operator of chiropractic clinics. At the end of 2018, they had a total of 442 clinics across the USA, of which 394 were franchised and 48 were company owned.
As any other franchisor, The Joint earns money by collecting fees from its franchisees as well as from running its own stores. These are the typical fees that the company collects:
a 7% fee on all franchisee gross sales or a 4% fee from stores under the supervision of their Regional Developers.
a 2% of the franchisee gross sales as a marketing fee.
a $39.900 franchisee sales fee whenever a franchisee buys a store license, or 50% of that whenever a Regional Developer sells a license.
A $29.900 fee whenever an existing franchisee purchases an additional license.
And what’s different form any other chiropractic clinic out there, you might ask. Well, it’s not their product or service per se, but how they’ve built the business. They are a cash based model, on a highly fragmented market with a really long runway for growth.
From the patient’s point of view, it couldn’t be better. The clinics are located in malls, allowing easy accessibility, no appointments are needed, a person can just walk in and get their back fixed. From a pricing perspective, it is very good too. The typical price for a chiropractic session is usually $74 while at The Joint it costs 25$.
From the chiropractor’s point of view, he or she doesn’t have to worry about managing a business without support, doesn’t have to worry about attracting new clients or deal with the insurance companies. While the average salary for a starting chiropractor is between $30K and $40K, at The Joint this number goes up to a range between $65K and $75K.
Like the CEO said, they aren’t revolutionizing chiropractic, but they’re certainly revolutionizing access to chiropractic.

2.2. LARGEST SHAREHOLDERS
From the list of the largest shareholders, I can recognise Bandera Partners. They are a value oriented hedge fund and one of their managers is Jeff Gramm, author of the book I’m currently reading and highly recommend called “Dear Chairman“.

2.3. MANAGEMENT TEAM
The management team is composed of highly qualified members. As they show us on their latest (and very good) corporate presentation most of them have long experience within the franchising industry.
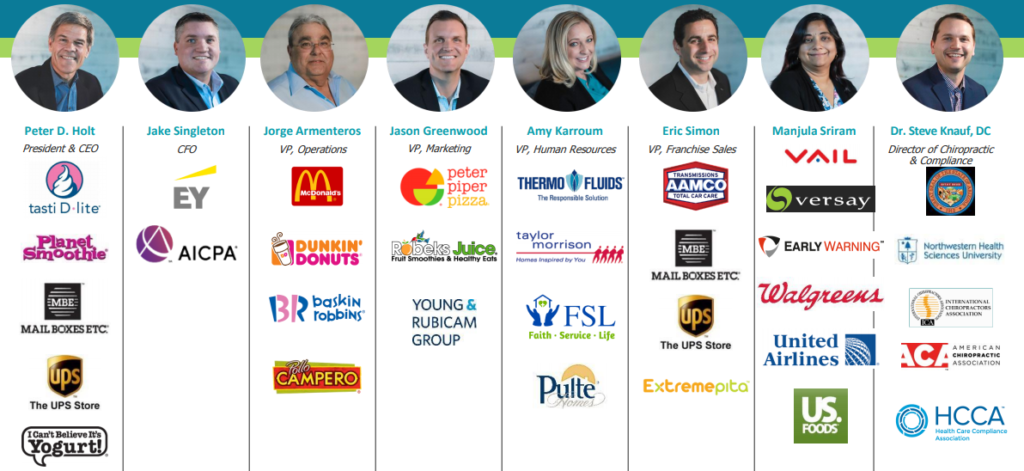
This management team was put in place in 2016 after the previous managers almost bankrupted the company by pursuing an aggressive strategy spending lots of cash growing corporate owned stores.
When Peter Holt came in, the company was a disaster. It was bleeding money, the franchisees were unhappy and the strategy that had been put in place wasn’t working. Just so you can get a better feeling of how things were, the company was spending big bucks developing a proprietary CRM system when there are lots of proven and cheaper ones out there.
After becoming the CEO, Peter Holt immediately stopped the cash burn, started recovering the relationship with the franchisees, closed down unprofitable clinics, switched from that expensive proprietary CRM system to a commercial one and expanded the regional developers program.
The only thing that I dislike about the management team is their low skin in the game. I would like to see them buying more shares.
3. HISTORICAL CONTEXT
3.1. LONG TERM CHART
The company’s IPO was back in 2014 at $6,5/share and that price is now $14,5.

3.2. MARKET CAP AND SHARES OUTSTANDING
Being a microcap, it’s fairly common to find some dilution in form of stock issuance to fund operations or growth. In The Joint’s case, they’ve issued significant amounts of stock in 2015 and 2016 to fund the opening of new company-owned clinics.
And as we can also see, the market cap followed the stock price. The company is now priced by our friend Mr. Market at roughly $200M.

3.3. SALES - OPERATING INCOME - OPERATING MARGIN
Sales have been growing at a 40% CAGR for the last 5 years reaching $31,8B in 2018.
2018 was also the year when the company reached positive operating income.
Given the fact that they have more or less the same costs for 100 stores as for 1000 stores, it’s on their best interest to grow their store count.

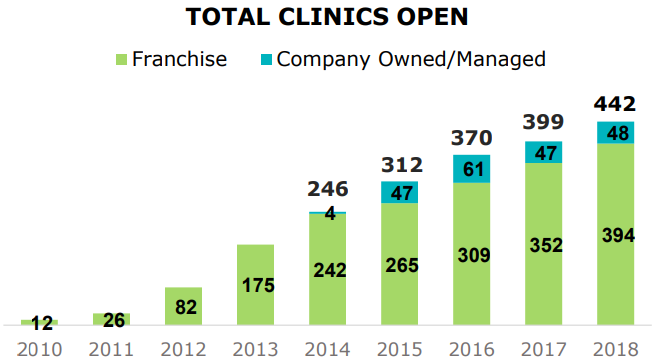
3.5. STORE COUNT
And that’s exactly what they’ve been doing so far.
At the end of 2018 they had a total of 442 clinics open, 43 more than in 2017.
We can now see what the CEO did back in 2017. He closed/sold 14 company-owned (and money draining) stores and in 2018 he bought back one single clinic and didn’t open any greenfield.
On the latest conference call, he said that they’ve opened 2 new company-owned stores this year. They’re taking it easy so they don’t make the same mistakes as the previous management team did.
3.6. COMPARABLES
This is where it gets interesting.
Their comparable sales are just amazing. For clinics that have been open for more than 13 months, the comparable sales have been growing at +24% whereas for those that have been open for more than 48 months, the comps have been growing at +16%. Even the CEO, who has been involved with franchising companies for a long time, commented that he has never seen comps like these.
3.7. NET INCOME, NET MARGIN
This is the first year that the company has turned a profit after becoming public. Net income for 2018 was $253M, representing a 1% net margin and as net income is expected to grow through the next years, because of the high operating leverage, the net margin will also go up.

You might’ve noticed that the net income is higher than the operating income and that’s due to an income tax benefit and due to a “bargain purchase gain” which is more less the opposite from an impairment charge.
Also noteworthy is the fact that they have $23,1M of NOL’s to offset future taxable income.
3.8. CASH FLOW
If we take a look at the cash flow statement, we can clearly see the enormous increase in CAPEX in 2015 while the management was aggressively opening new clinics. When the new management came in, it stopped the bleeding immediately. And this is why I love to analyse a company’s financial statements. You can clearly see the strategy laid out by management mirrored on the company’s numbers.
Something that I really like to see is that although the net income was just $253.000, the FCF was $4,3M.

3.9. SEASONALITY
There is some seasonality to The Joint sales, the 4th quarter being the strongest one.
3.10. DIVIDENDS
The company doesn’t pay a dividend.
3.11. PROFITABILITY RATIOS
As the company has just turned profitable there is no chart here. The Return-on-Equity for 2018 was 11% and the Return-on-Assets was 1%, but these are not really helpful right now because they don’t translate the company’s future (and expected) earnings power.
3.12. FINANCIAL RATIOS
The company’s current ratio is 1,3. Although I consider it to be at a good level, I would like it to be a bit higher. The debt-to-equity ratio is 0,5 which is great.

But what this last ratio doesn’t show us is that the company has net cash, meaning it has a lot more cash in the bank than debt. So let’s compare it to EBITDA.
Here we have it….

This is even a negative number because of the “negative debt”, so financially, the company is very sound.
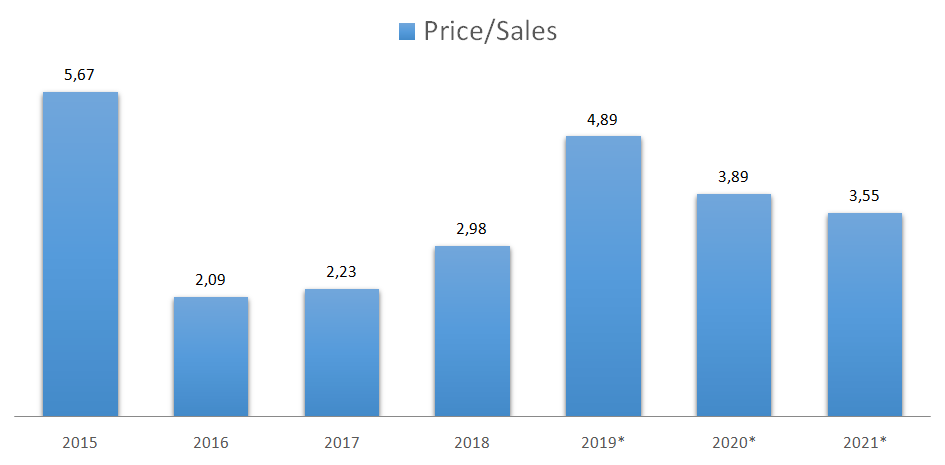
3.13. PRICE RATIOS
With the recent share price hike, the Price-to-Sales ratio has gone up to 4,9 which obviously means that Mr. Market is expecting good growth ahead.
4. GAINING PERSPECTIVE
4.1. INDUSTRY AND STRATEGY
The US chiropractic industry is a large and highly fragmented one. It is estimated that the annual spending on chiropractors alone is around $15B, so the runway for The Joint is really long.
But because this is a price driven market with a product that is more or less a commodity and because there are no obvious barriers to entry, I’ve struggled to understand this company’s competitive advantage. And then the CEO said the following:
“Because there is nothing out there to acquire and then convert in a rapid manner.
It’s really, it’s going to be building unit-by-unit if you want to compete with this business model.”
And that piece of info together with the table below where we can see the company’s main competitors (and the number of independent offices)….

… is what lead me to understand The Joint’s first mover advantage.
Their largest competitor has almost half of their store count and its business model is the traditional insurance based one. The third competitor has 10 times less stores than The Joint. Even if the second guy bought the third and fourth competitors, he would still be 144 stores behind The Joint.
For these guys to grow their store count, they have to open those stores one by one, just like The Joint did, but The Joint has a significant head start, especially with its regional developers program starting to bear fruit.
This is a simple, asset light business model with high operating leverage. At a certain point, with a relatively small staff at headquarters, they can expand their footprint without having to manufacture another product or hire new people. That’s the beauty of the franchising business.
They’ve been seeing tremendous growth. System-wide sales have grown 30% in 2018 alone, comps are just astonishing and the managers see the opportunity for more than 1700 clinics in the US alone.

4.2. RISKS AND COMPETITION
The first risk that comes to my mind is the risk of wanting to get rich quickly and let these amazing compounders go by. On a more serious note, I see the following risks:
Risk of execution, as we’ve seen happening with the previous management team.
Risk of competition. Although we’ve seen that the current competition is far away on the rear view mirror, there is always the possibility for a deeper pocketed competitor to come into this space.
4.3. TYPE OF PLAY
The Joint is definitely a growth company.
5. OVERVIEW AND CONCLUSION
5.1. OVERVIEW
I think by now I’ve made a very compelling case regarding the ability of this company to grow for a long time. It reminds me of Peter Lynch and The Dunkin Donuts. The Joint management doesn’t have to develop a new drug or design a faster car. It just has to keep on executing like it has been doing for the last couple of years.
The company is the leader on a highly fragmented industry, is already profitable, has net cash on the balance sheet and it has a more than capable management team.
Although this is a simple business, making estimates will invariably lead to great inaccuracies due to the high degree of assumptions that have to be made when talking about a high growth company. But let’s try and outline a conservative scenario:
- 75 new franchise openings every year reaching 2028 with 1194 franchise clinics. I’m extrapolating the medium figure from the 2019 guidance but I think this can be much higher due to their Regional Developers program.
- 10 new company-owned stores in 2019, 15 per year until 2023 and 20 thereafter, reaching 2028 with 15% of the total number of clinics owned by the company.
- 30% operating margin for the company-owned stores.
- 14M shares outstanding
- PE of 25 for 2023 (high growth company with long runway) and PE of 20 for 2028 (more mature company with shorter runway).
If all these assumptions turned out to be right (they won’t), the company could be doing $0.8 EPS in 2023 and $1.98 in 2028. That would lead to a 2023 share price of $20.1 representing an 8% CAGR and a 2028 share price of $40, representing an 11% CAGR.
Unfortunately, because of the recent doubling in price, the stock is now obviously more risky than when I first looked at it and I would argue that the expected sales growth for the next couple of years already seems to be accounted for on the stock price.
As we know, the fact that this is a microcap can, on the one hand, lead to a high price volatility and on the other hand lead to long periods of price stagnation as it backfills the fundamentals. The time horizon on this one should be 5, 10, 15 years out. It’s just a matter of regularly checking out if the management is executing and if any material change has happened that might influence the investment thesis.
I would like to end this analysis by thanking Mike Schellinger, co-founder of the MicroCapClub, for helping me understand some of the peculiarities of this business. Thank you Mike.
5.2. CONCLUSION
This section will be available to paying subscribers in 2019 when we launch the Portfolios. If you’d like to get early-bird conditions, please send us an e-mail.
Don’t forget to check our other analyses. If you want more, join us at our new Facebook group.
6. DISCLAIMER
The material contained on this web-page is intended for informational purposes only and is neither an offer nor a recommendation to buy or sell any security. We disclaim any liability for loss, damage, cost or other expense which you might incur as a result of any information provided on this website. Always consult with a registered investment advisor or licensed stockbroker before investing. Please read All in Stock full Disclaimer.