Tiffany & Co.,
a fundamental analysis!
April 04, 2019
SHARE PRICE: $106,9
MARKET CAP: $12,98B
April 04, 2019
Share Price: $106,9
Market Cap: $12,98B
1. INTRODUCTION
Tiffany & Co is arguably the best known jewelry brand in the world mostly due to the Oscar winning movie Breakfast at Tiffany’s starring Audrey Hepburn but also because of that robin egg blue box. I’m really curious about what I’ll find on their website.
OK, before we go on let’s pause for a moment and ask ourselves which company sells $700 Leather and Walnut table tennis paddles?
….No. I’m sorry. I thought that the table tennis paddles were the apogee of this company’s pricing power but I was wrong. I can imagine a millionaire kid showing off the paddles to his friends while opening an expensive bottle of wine in his mansion, but….but…..
….a $1,250 Tape Measure?!?! I would love to see the faces of all those construction workers whom I’ve worked with for so long if I had brought one of these to the construction site.
2. BUSINESS OVERVIEW
2.1. BUSINESS DESCRIPTION
Tiffany & Co. is a luxury retail business founded in New York in 1837 by Charles Lewis Tiffany and Teddy Young. Soon after the opening, the store was acclaimed as the palace of jewels.
It’s core business is the sale of jewelry, especially diamond related, but it sells other luxury items, like china, timepieces or the tape measure up there which are usually made by others to the company’s specifications.
The company has its own diamonds supply channels but still buys a great part of the rough diamonds from producers in Botswana, Canada and South Africa (among others) and then processes, cuts and polishes them in company owned facilities, combines them with precious metals and sells them through its own brick and mortar stores or through its website.
2.2. LARGEST SHAREHOLDERS
I would like to see someone from the original family still owning a big chunk of the company, but while going through the company’s history, I’ve found out that it was bought and sold several times over the years. The big funds are now the largest owners.
Interesting to see that the Qatar Government has a 9,7% stake in the company. Not that much of a surprise, since they have been building stakes in other luxury brands like LVMH or Harrods.

2.3. MANAGEMENT TEAM
After the previous CEO left because of disappointing financial results, Alessandro Bogliolo was appointed by the board in 2017 as the new CEO. He is a newcomer to the company, which is something I don’t particularly like, but I’ll give him the benefit of the doubt. He comes from Diesel, where he was the CEO for the past 4 years and the responsible for turning Diesel into a luxury casual brand. He has also worked 16 years for luxury jeweler Bulgari.

3. HISTORICAL CONTEXT
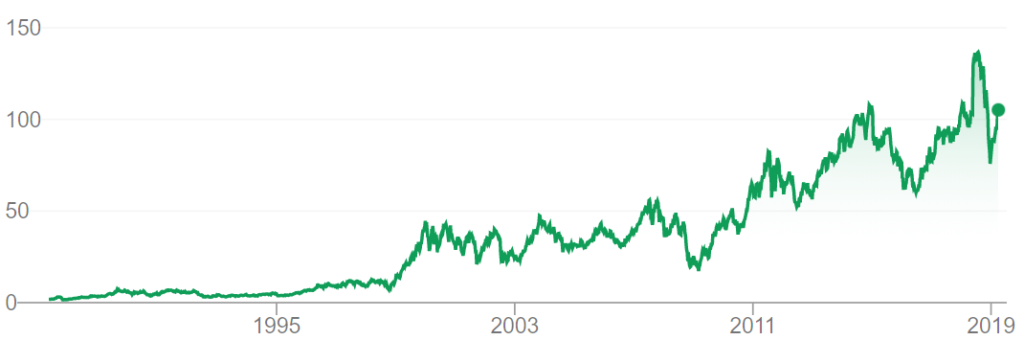
3.1. LONG TERM CHART
The stock price is now at $106,9. The long time trend is obviously positive, with some setbacks here and there.
3.2. MARKET CAP AND SHARES OUTSTANDING
There was a big increase in the number of shares outstanding in 1996 and a massive share repurchase program between 2005 and 2008.
In 2008 they still had an authorized share repurchase program of half a billion dollars but they stopped it in order to maintain the strong cash balance needed to withstand the severe crisis that was starting.

3.3. SALES - OPERATING INCOME - OPERATING MARGIN
Sales have been growing at an annual rate of return of 8,5% since 1990, but the operating margin has been somewhat erratic throughout the years.
That blip in 2013 was related to an adverse arbitration award that forced Tiffany to pay Swatch $480 Million in relation to a joint venture gone bad.
The other blip back in 93 was a realignment of the business in Japan, when they had to buy back merchandise previously sold to a business partner.

If we don’t take into account those two events, the operating margin has wobbled around the mid teens, occasionally growing to the high teens like in recent years when it almost reached the 20% mark.
3.4. SALES BY GEOGRAPHY
Let’s take a look at how the different regions of the world contribute to the overall revenue.

Everything fairly stable for the last 6 years. A special mention for the Asia Pacific region, that unsurprisingly was the fastest grower.
3.5. SALES BY SEGMENT
The company separates sales in its own particular way. Let’s take a look how these have performed over recent years.

Again, everything fairly stable with Collections running the show and with a slight drop in the Engagement Jewelry segment, I would say mostly related to the decrease in weddings in western countries.
3.5. GROSS MARGIN
Gross margin plays a big role in Tiffany’s numbers. In fact, in every Tiffany’s Report that I’ve read, management always stresses the need to increase gross margin, and guess what ……. they’ve been keeping their promises, especially for the last decade. Gross margin is at 64%, an all time high.

I am trying to find data regarding rough diamonds prices over the years, but without success. If any of my readers knows where to find it, just let me know.
3.6. COMPARABLE SALES
The company has been able to grow its comps at 4% in 2018.
3.7. NET INCOME, NET MARGIN
Net Income for 2017 was $370 Million. This drop was mostly due to the Tax Cuts and Jobs Act. And exactly because of it, and because the income tax for US companies has been lowered by Trump from 35% to 21%, the net income in 2018 has reached the all time record of $586M.

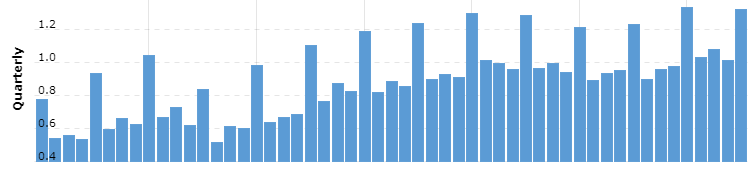
3.9. SEASONALITY
There is high seasonality of sales in the jewelry business. Predictably enough, the fourth quarter is the strongest one, usually representing around one-third of annual sales.
3.10. DIVIDENDS
As expected the company has been raising its dividends every year for the last 19 years. The dividend yield is currently 2%.

3.11. PROFITABILITY RATIOS
If we dismiss one time events like 1993 and 2013, ROE has been around the mid to high teens for the last 30 years, which goes to show the quality of this business.

3.12. FINANCIAL RATIOS
What about he balance sheet?
Perfect ratios here. Debt to Equity ratio under 0,5 and Current Ratio is 6. Among the companies that I’ve analyzed here at All in Stocks, I think this one is only surpassed by Facebook relating to the soundness of the balance sheet.

3.13. PRICE RATIOS
The historical average PE ratio is 22 and the PE ratio for 2019 is at 21, so more less in line with history.

4. GAINING PERSPECTIVE
4.1. INDUSTRY AND STRATEGY
Pat Dorsey, the founder of Morningstar, had this to say about Tiffany’s on his book :
“Tiffany is able to charge consumers a lot more on average for diamonds with the same specifications as those sold by its competitors, mainly because they come in a pretty blue box. For example, as of this writing, a 1.08- carat, ideal-cut diamond with G color and VS1 clarity mounted in a platinum band sold for $13,900 from Tiffany. A diamond ring of the exact same size, color, and clarity, a similar cut, and a platinum band sold for $8,948 from Blue Nile. (That’s an expensive blue box!)”
So the greatest asset the company has is an intangible one: its brand. It sells overpriced jewels, some of them you can find at much lower prices elsewhere, but because they come in that little blue box, they can be sold at higher prices.
Another important piece of the puzzle is the current management team and its strategy. Alessandro Bogliolo brings a fresh and bold attitude with him. He came aboard with a very clear focus on re-freshening the company’s image, something that had already been started by Reed Krakoff, the also newly appointed Chief Artistic Director. So these two seem to be singing the same tune regarding their vision for Tiffany’s future.
Alessandro has said that “Formality doesn’t equal luxury“, that Tiffany has to let go of the European dull idea of luxury while Krakoff is the responsible for revamping the image of the company.
He is the mastermind behind The Blue Box Cafe, on the 4th floor of the historical NY store, the new collection Paper Flowers, and the campaign that put Elle Fanning dancing to the sound of Hip Hop on the spring commercial.
4.2. RISKS AND COMPETITION
I’m going to read the risk factors on their 2018 Annual Report and single out the ones I think are the most important:
Supply Chain: Given the fact that it’s operations are global and it outsources the diamonds from not so stable countries, it is subject to different laws and regulations regarding its supply chain as well as regional instability or conflicts.
Consumer: Although diamonds and jewelry don’t change a lot, general consumer trends and shopping patterns do. The company might not be able to respond to those shifts in a timely manner.
Competition: The consumer acceptance of synthetic diamonds or treated diamonds (naturally occurring diamonds subject to treatment processes, such as irradiation) may lead to a decrease in the demand for real diamonds.
General economic conditions.
4.3. TYPE OF PLAY
I consider Tiffany & Co. a slow growth play.
5. OVERVIEW AND CONCLUSION
5.1. OVERVIEW
I like where things are going. In fact I like it a lot. I have seen some of these rejuvenating strategies do wonders for old traditional companies and I’m hoping the same will happen here.
They are shaking things up, targeting a younger public, renovating their iconic store in the 5th Avenue in 2019, launching e-commerce in China…
I don’t see this as a fast growing company. I think they will grow revenue at a low single digit for years to come.
If in the next 5 years they can grow revenue at a 5% rate and if they are able to maintain their margins, they will reach the end of 2023 with $793M in net income. If we apply the historical PE ratio of 22 and estimate that the dividend per share will continue to rise at a 10% rate, we get to a $157 share price which represents a 7,9% CAGR, too far from the mid double digits I am aiming for.
I’m a bull on their strategy and I would love to own this company (all of it), but with a PE of 21, more less in line with its history, this isn’t cheap.
5.2. CONCLUSION
This section will be available to paying subscribers in 2019 when we launch the Portfolios. If you’d like to get early-bird conditions, please send us an e-mail.
Don’t forget to check our other analyses.
If you want more, join us at our new:
6. DISCLAIMER
The material contained on this web-page is intended for informational purposes only and is neither an offer nor a recommendation to buy or sell any security. We disclaim any liability for loss, damage, cost or other expense which you might incur as a result of any information provided on this website. Always consult with a registered investment advisor or licensed stockbroker before investing. Please read All in Stock full Disclaimer.