Yum! Brands,
A fundamental analysis.
Yum! Brands,
A fundamental analysis.
SHARE PRICE: $93.33
MARKET CAP: $29.15B
1. INTRODUCTION
I’ve recently written an analysis on McDonald’s so I thought I’d better analyze and compare its competitor, Yum! Brands too. As always, I’ll start by taking a look at their website.
2. BUSINESS OVERVIEW
2.1. BUSINESS DESCRIPTION
YUM! Brands was born out of a spin-off from PepsiCo Inc. back in 1997 and operates or franchises over 48.000 restaurants mainly through 3 fast food concepts: KFC, Pizza Hut and Taco Bell.
Like other franchise food chains, Yum makes money by collecting fees from the restaurant owners that wish to carry one of their brands. Typically they collect an upfront fee when a license for a restaurant is attributed, and afterwards they collect royalties on a percentage of sales. These royalties are usually in the range of 4 to 6%, except for Master Franchisee Arrangements where it goes down to 3%.
Yum! also makes money through rental or subleases of restaurants, advertising fees and other smaller fees.
Unlike McDonald’s, Yum! owns just 580 buildings, representing 1,2% from the total of 48.000, while McDonald’s owns between 70% to 75% . That’s already an enormous source of revenue missing from its books.
2.2. LARGEST SHAREHOLDERS
The largest shareholders are the big funds.

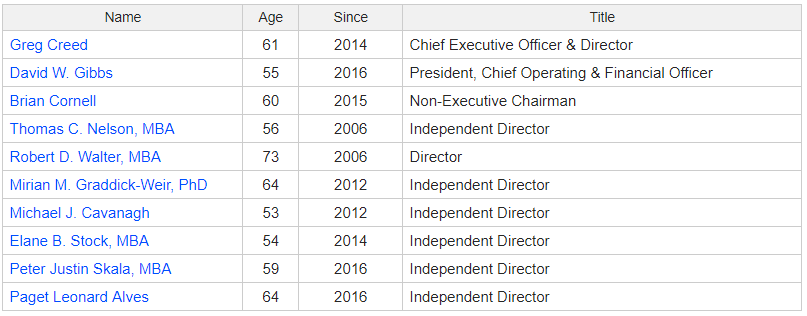
2.3. MANAGEMENT TEAM
The CEO Greg Creed was previously the COO of Yum and is currently also an independent director at Whirlpool.
3. HISTORICAL CONTEXT
3.1. LONG TERM CHART
Yum! Brands spin-off from PepsiCo. Inc. was back in 1997. Share price has gone up at an annual compound rate of 14% and it’s now at $93,33.

3.2. MARKET CAP AND SHARES OUTSTANDING
Since the IPO, the number of shares outstanding has been steadily declining, which is a trend I really like to see.
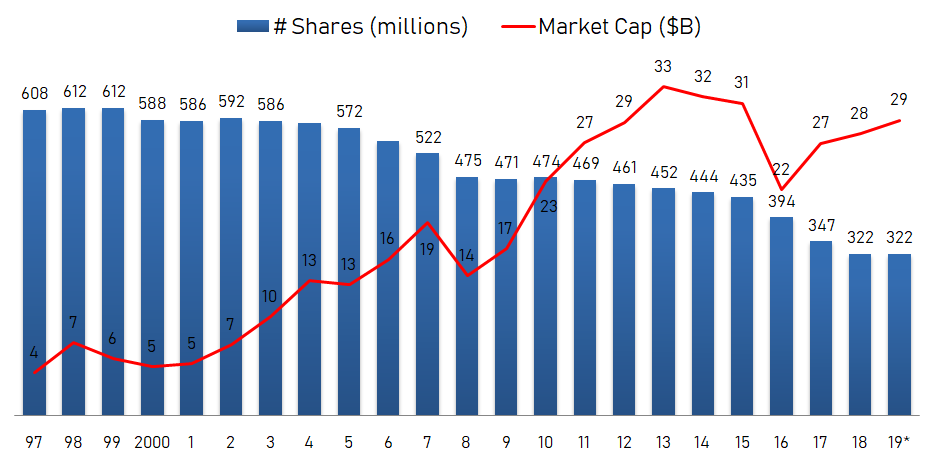
The Market Cap at the end of 1997 was just $4 Billion, then it went up to the $33 Billion mark in 2013 and the company is now priced by Mr. Market at roughly $29 Billion.
Let’s keep in mind that McDonald’s market cap is around $134 Billion, so 4,6x bigger.
3.3. SALES - OPERATING INCOME - OPERATING MARGIN
Sales for 1997 were $9,7 Billion and for 2018 they were $5,7 Billion.
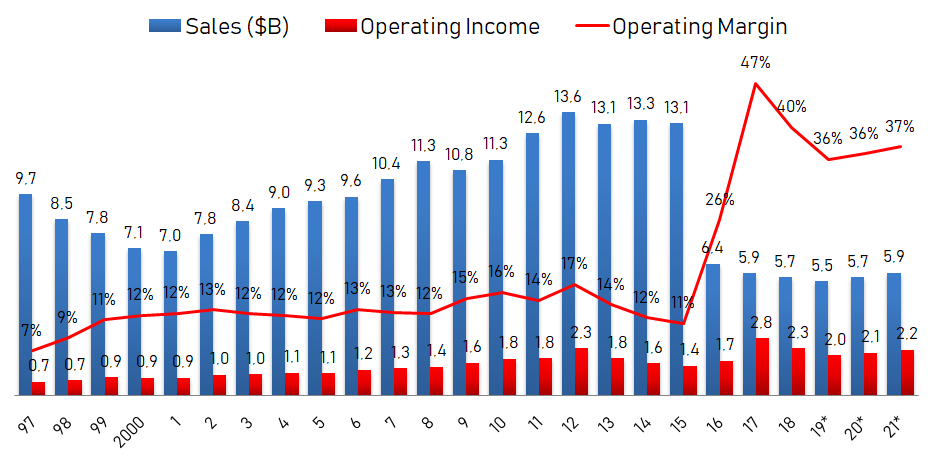
So “what happened there in 2016?” you might ask.
Like other american franchising companies (McDonald’s is one of them), Yum! ran into trouble in China.
It was having problems with its supply chain and guaranteeing high quality from afar proved out to be extremely difficult. So, they found a simple way to solve this problem.
They spun-off Yum! China. They still collect a fee of 3% of sales but it is now an entirely different company. I can see that it is publicly traded in the NYSE under the ticker YUMC, so I might be analyzing it soon.
Let’s take a look at the chart without the sales coming from China from 2013 onward, so we can better see the evolution.

Although China was bringing in loads of cash, it was also costing to much to maintain. Operating margins for 2013/14/15 have gone from the low teens (with China) to the low twenties (without China). Maybe the idea of spinning-of China wasn’t that bad after all. Still, sales have been dropping year after year but the management has been able to transform Yum! into a much leaner company and that shows on the operating margin that reached 40% in 2018.
3.4. SALES BY GEOGRAPHY
Revenue is almost perfectly split between the US and the rest of the world:

3.5. SALES BY CONCEPT
KFC is the strongest of the three brands, bringing in half of total revenues, followed by Taco Bell and Pizza Hut.
I like the fact that Taco Bell is growing leading to a more diversified product mix.

3.6. REVENUE SPLIT
At the end of the 2018 Yum! had a sum total of 48.124 restaurants of which 1,7% were company-operated and 98,3% were franchised. The goal previously set by management of a 98% share of franchised restaurants for 2018 has been accomplished.
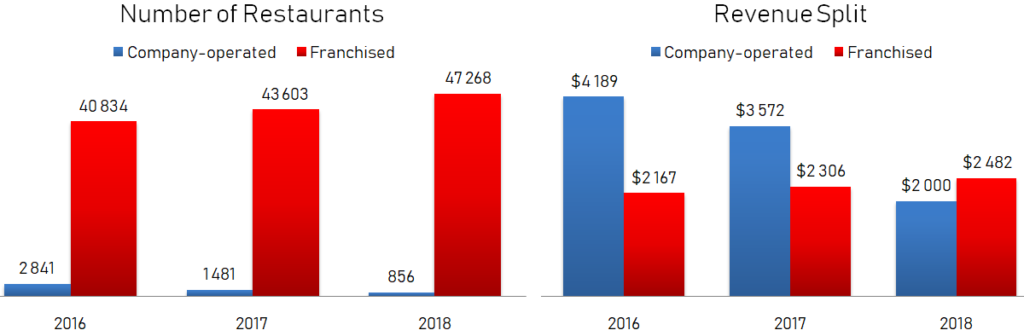
As in the McDonald’s analysis, the “few” company-operated restaurants have been bringing the bulk of revenues, and finally in 2018 inflection point has been reached.
3.6. OPERATING INCOME AND MARGIN SPLIT
We can see that franchised restaurants offer a 92% operating margin to Yum! Brands. That’s why we’re witnessing this movement towards an asset light structure with less company-owned restaurants.

3.6. OPERATING INCOME PER STORE
I thought it would be nice to compare operating income from each store to Mcdonald’s figures.
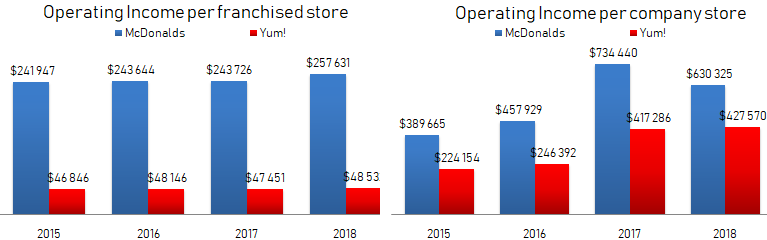
I had to check and recheck these numbers to be sure there were no mistakes. McDonald’s brings in much more cash from each store, especially the franchised ones (left hand chart).
3.6. COMPARABLE SALES
Same-store sales growth is still positive remaining on 2% in 2018, which is nice to see.

3.7. NET INCOME, NET MARGIN
Net Income for 2018 was $1,5B, up 15% from 2017 and analysts expect it to be much lower in years to come.

3.9. SEASONALITY
There is some seasonality to Yum! Brands sales, the 4th quarter being the bst performing quarter.
3.10. DIVIDENDS
Dividends per share were 1,4 in 2018 and the dividend yield is 1,8%.

3.11. PROFITABILITY RATIOS
Yum! is in a similar situation as McDonald’s with negative equity and those values of around 60% between 2009 and 2014 tell me that there was too little equity.
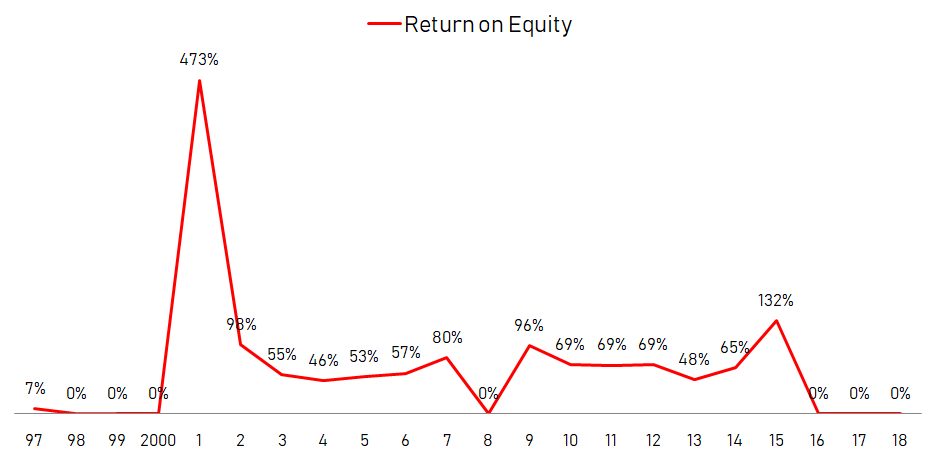
In this cases it’s better to look at the return on assets.
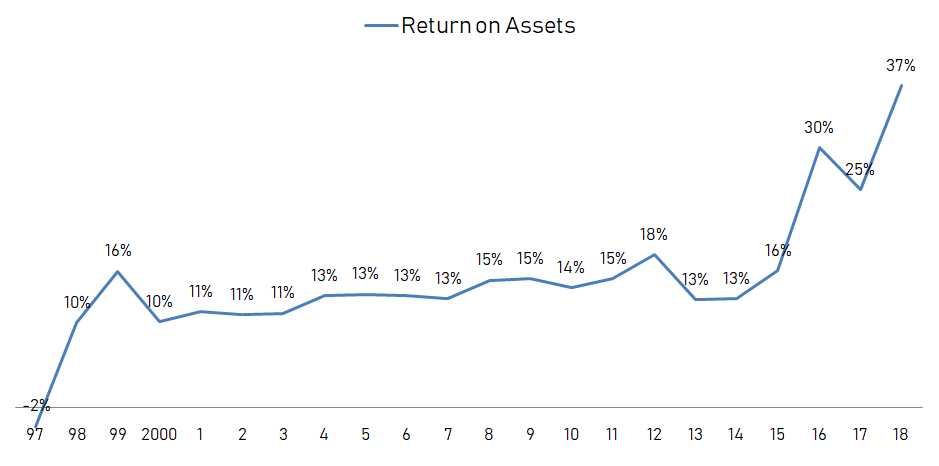
I like to see ROA going up through the years, and the recent spike is mainly due to the spin-off of China assets together with the move to a more asset light business.
3.12. FINANCIAL RATIOS
Let’s take a look at the Current Ratio and afterwards we’ll talk about the debt.
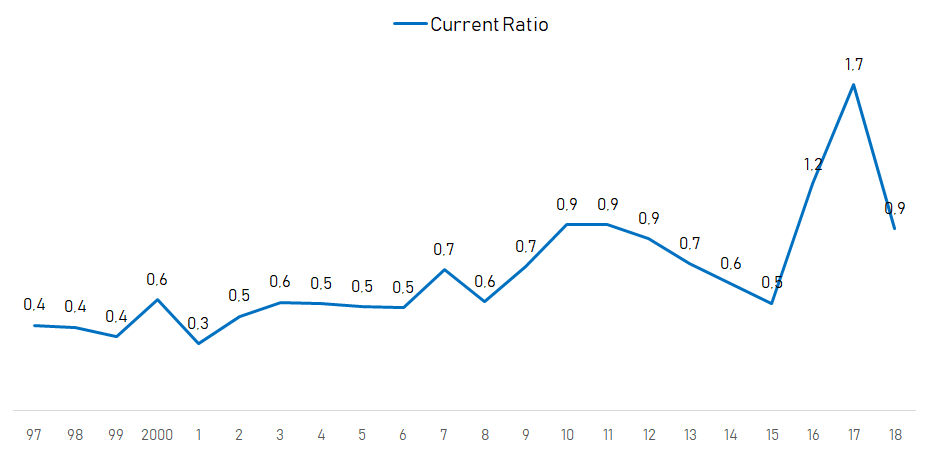
After the spin-off, the current ratio got a lot better. If we look at numbers prior to the spin-off we see that it’s usual for Yum! to have a current ratio below 1, which means that it has more current liabilities than current assets to pay for those liabilities. This is not uncommon in retail.
Basically the company is financed by its vendors who are payed some months after they deliver the goods while clients pay immediately and franchisees pay in the subsequent 30 days. As a result, inventory turns faster that the related short-term liabilities.
Now let’s take a look at its debt.
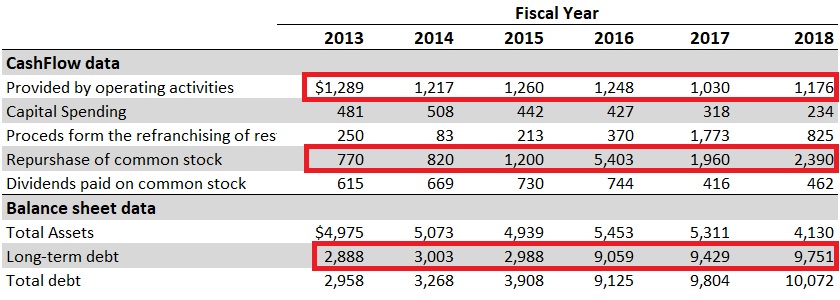
Once again we see the company getting in to debt to finance share repurchases and dividends instead of investing in the business. Management has said that it wants the Debt/EBITDA ratio to be just below 5 (which I consider too high), and they are managing that, but with sales declining every year, I don’t know if EBITDA wont come down as well.
3.13. PRICE-TO-EARNINGS
Forward 2018 PE is currently at 25 and the historical PE for Yum! is 18.

4. GAINING PERSPECTIVE
4.1. STRATEGY AND RECENT DEVELOPMENTS
I remember reading something about a joint venture between Yum! and Telepizza so I’m going to do a quick research on it…..
Ok, here it is. Pizza Hut and Telepizza have decided to combine efforts instead of battling with each other. Telepizza is going to be Pizza Hut’s master franchisee for Latin America (excluding Brasil), the Caribbean, Spain, Portugal and Switzerland. Telepizza agrees to gradually convert its existing stores in Latin American to the Pizza Hut brand, allowing Pizza Hut to enter this major market with a head start.
Last year Yum! agreed to buy 3% of Grubhub for $200M, which implies a $6,6B valuation for a company that had profits of $78M in 2018, or in other words, a PE ratio of 85!!!! If we don’t look at the price tag, this operation means that management is adapting and that they are serious about their online business. But hey, a PE of 85 can’t be called good capital allocation.
4.2. RISKS AND COMPETITION
As usual I am going to read the Risk Factors in the latest Annual Report and single out the most important ones:
Inability to adapt to new consumer preferences
Unfavorable general economic conditions
Food safety concerns
Exposure to China
Too much debt
4.3. TYPE OF PLAY
I consider Yum! Brands a (possible) turnaround.
5. OVERVIEW AND CONCLUSION
5.1. OVERVIEW
The reasons that lead me to be careful with McDonald’s are the same that now lead me to be careful with Yum! Brands. They both operate in an industry will low barriers to entry where everyone can open a restaurant and sell through UberEats and other delivery platforms. Don’t get me wrong, I see online ordering as a tailwind for Yum! too, but it is leveling the playing field for everyone now.
Like other companies on this line of business, Yum! has been facing extreme competition from all sides and I don’t see this scenario changing anytime soon. With small casual eating restaurants popping out everywhere, with every supermarket providing ready-to-eat food, and with the democratization of online delivery platforms like Uber eats, everyone can have whatever food they want at their door, within minutes. All of that combined with the conscious and healthy eating trend we’ve been witnessing for some time now, leads me to believe that Yum! will have a hard time going forward.
I think that what management has done, spinning-off China, partnering up with Telepizza, reducing company-operated restaurants and expenses, managing to raise margins and income in a declining-sales environment is what they should have done, but although I like their strategy, I prefer to wait until sales have leveled off (or started to grow), until management pays down debt and until the company eventually turns around.
5.2. CONCLUSION
This section will be available to paying subscribers in 2019 when we launch the Portfolios.
If you want more, join us at our new Facebook group.
6. DISCLAIMER
The material contained on this web-page is intended for informational purposes only and is neither an offer nor a recommendation to buy or sell any security. We disclaim any liability for loss, damage, cost or other expense which you might incur as a result of any information provided on this website. Always consult with a registered investment advisor or licensed stockbroker before investing. Please read All in Stock full Disclaimer.