The Gym,
a fundamental analysis!
The Gym,
a fundamental analysis!
March 23, 2019
SHARE PRICE: £2,265
MARKET CAP: £311M
1. INTRODUCTION
If you ask God Google or Yahoo Finance what the Price-to-Earnings ratio for The Gym Group is, they will answer you 42 or 45. So why on Earth would I be looking at a company that’s trading at such a high valuation? It’s quite simple, the PE can be a misleading ratio quite often and sometimes we have to look under the hood (or bonnet, depending on where you are). In fact, I think that Mr. Market is completely misjudging this one. Let’s start by taking a look at their latest and very informative presentation.
2. BUSINESS OVERVIEW
2.1. COMPANY PRESENTATION
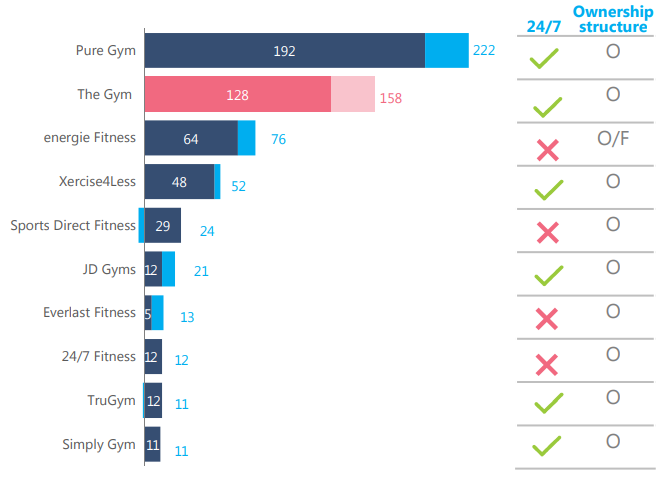
With 158 gyms across the UK, the Gym Group is the second largest low-cost gym owner and operator just behind Pure Gym (218 gyms).
This is the fastest growing fitness segment in Europe. The Gym sites are open 24/7, you access them with a pin code so the company saves money by not having a front desk, you don’t need a contract, everything can be done online, you get the chance to workout at any of the company’s gyms, you even get free group classes. The Gym doesn’t have swimming pool, sauna or any of those fancy things a regular health club has.
Their basic strategy is to be the lowest cost gym operator with a high emphasis on tech and reinvest all the cash back into the business in order to get scale.
Scale in this business is (almost) everything because as the company gets larger, it gets greater bargaining power with its landlords and equipment providers, two of the highest expenses a gym has. The Gym Group typically leases its locations for periods of 15 years, the first one being free. This is a major competitive advantage compared to smaller players that can’t get these deals, so what we’ll see in the future is 2 or 3 major companies dominating the industry.

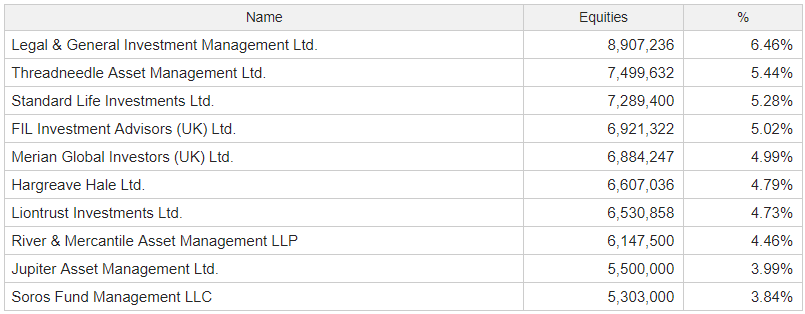
2.2. LARGEST SHAREHOLDERS
The major shareholders are all institutions. The founder, John Treharne, owns 4.853.191 shares, or 3,5% of the total shares outstanding and the new CEO owns about 1,180,347 shares, or 0,8% of the company. Is this enough skin in the game? I must confess, I would like to see more.
It’s important to say that in 2018 John Treharne sold some of his shares and I think that’s one of the reasons Mr. Market is mispricing this company.
Here is an interview with him. He was a professional squash player and he is quite experienced in this area, having already floated 2 fitness companies in the stock market.
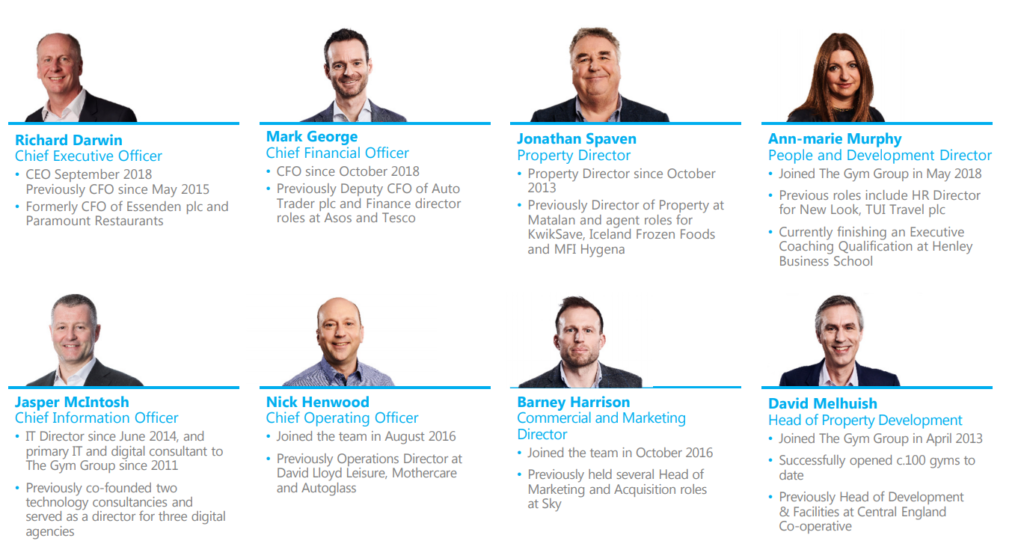
2.3. MANAGEMENT TEAM
Unfortunately John resigned from CEO last year and the previous CFO, Richard Darwin, took his place. Treharne is staying as a director but he won’t be in charge of daily activities.
For 2017, the CEO’s total compensation was £440.000 which is less than 0,5% of the total revenue, which I think is a fair compensation, especially when most of it came from performance based compensation.
3. HISTORICAL CONTEXT
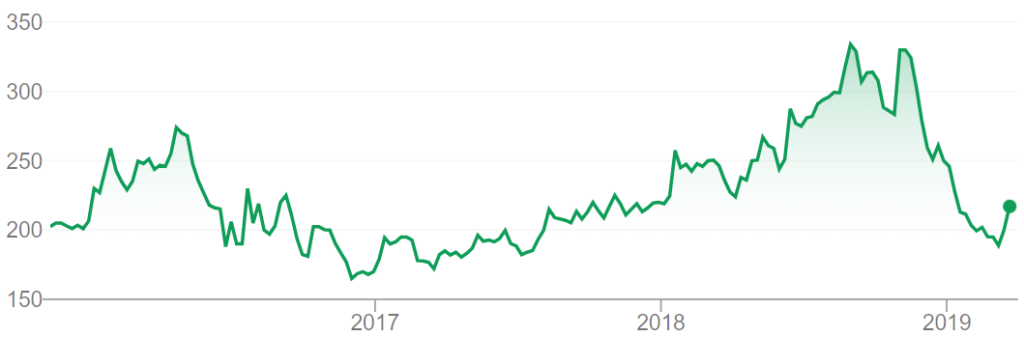
3.1. LONG TERM CHART
The stock is now trading at £2.26, much lower than at its height when it was trading for £3,34 in 2018.
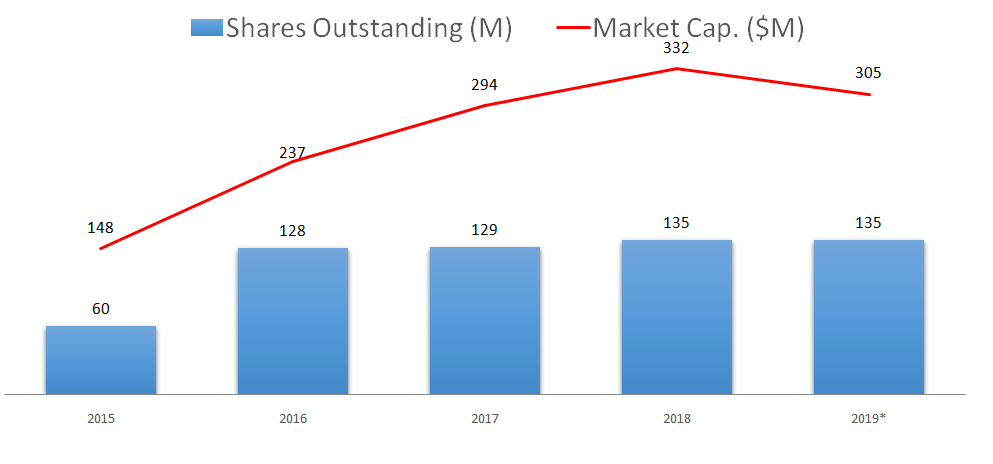
3.2. MARKET CAP AND SHARES OUTSTANDING
The current market cap is $305M. With these young and fast growing companies, it is natural to see some dilution to the existing shareholders as the management doesn’t want to overburden it with debt.
There was an equity placing in 2018 to fund the acquisition of 13 gyms from Easy Gym, taking the share count to 135 million.
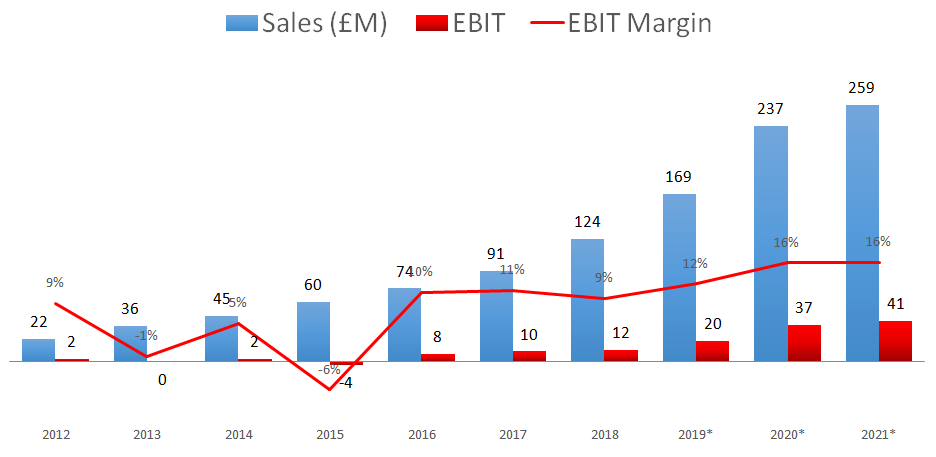
3.3. SALES - OPERATING INCOME - OPERATING MARGIN
Sales have been growing at 27% yoy for the last 5 years, having reached £124M in 2018 and are expected to reach £259M in 2021 with the operating margin reaching 16% because of the high operating leverage of the business.
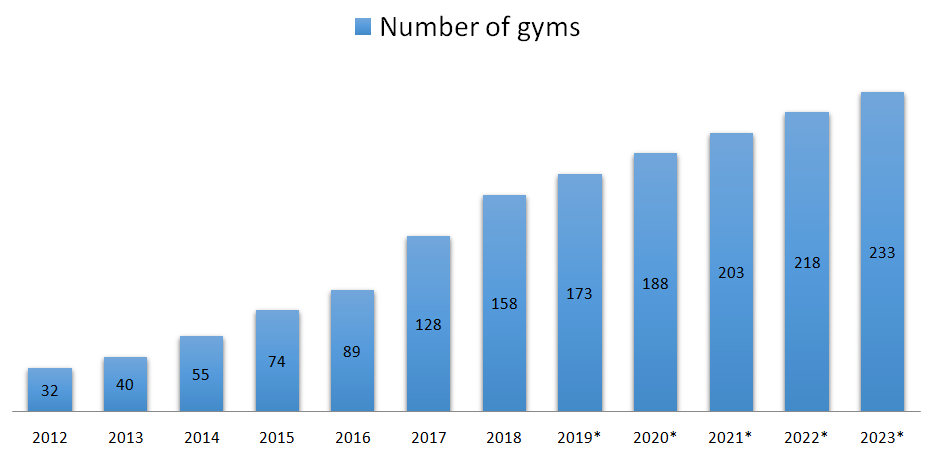
3.5. NUMBER OF GYMS
The company has been growing its number of gyms reaching the end of 2018 with 158 open locations, mostly inside the M25 in London.
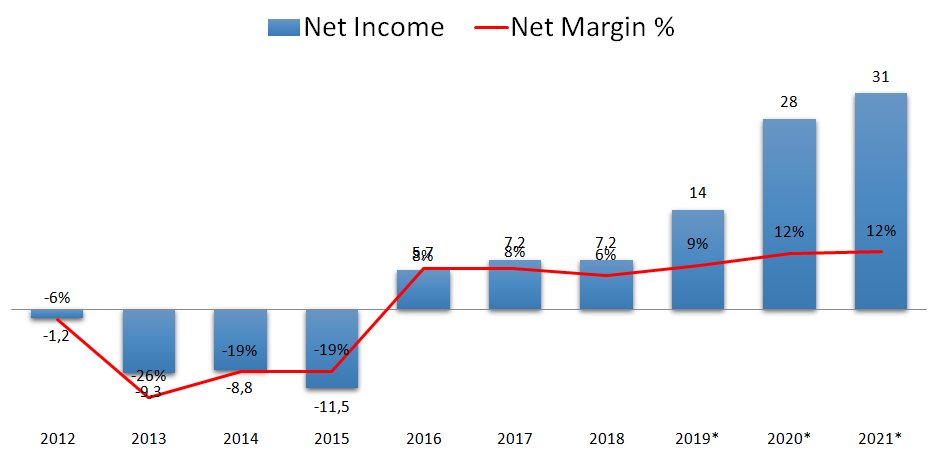
3.6. NET INCOME, NET MARGIN
Net Income for 2018 was £7,2M due to higher depreciation charges related to the recent acquisition and that’s why I don’t think this is a good metric to look at.
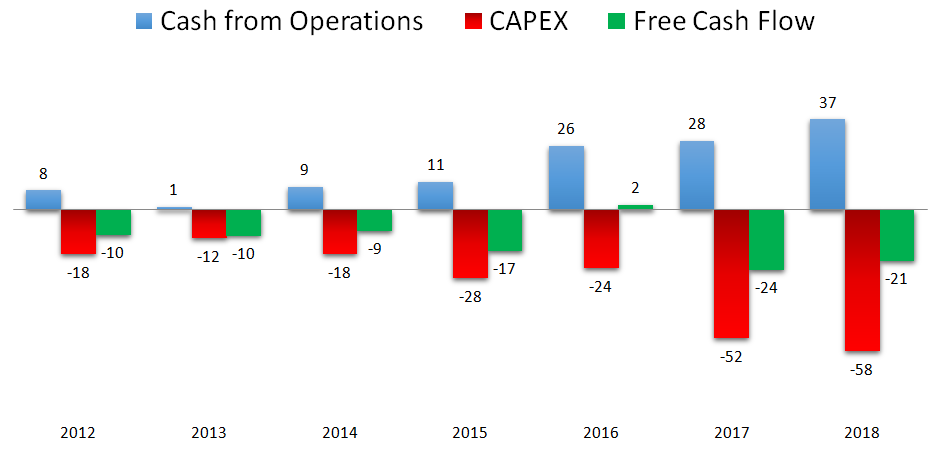
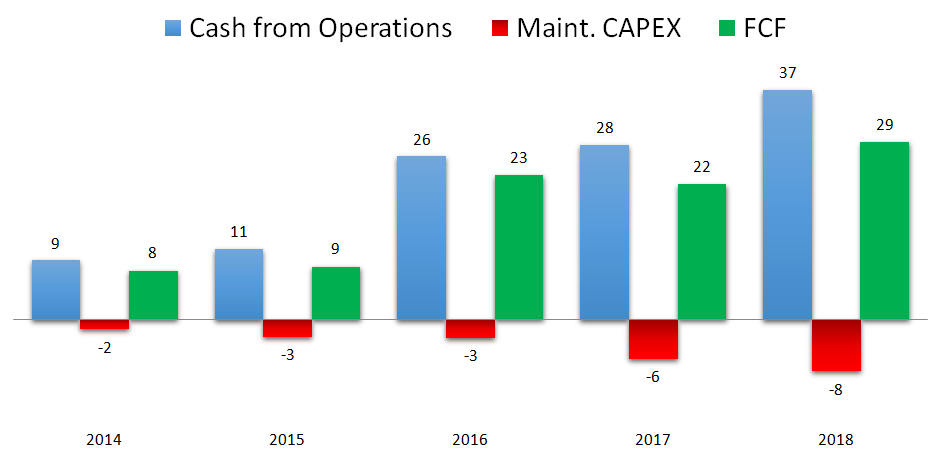
3.7. CASH FLOW
The Gym is another example of why we should be looking at FCF instead of accounting earnings. Because the depreciation and amortization expenses are way higher than the maintenance Capex, net income is depressed.
At first sight, I would be somewhat disappointed to see that the company has negative FCF but the truth is that they are spending a lot of cash to grow their business.
If we were to take the growth Capex into account, we would see a negative FCF figure of -£21M.
(FCF= Cash from operations – Capital Expenditures)
But luckily for us, the company makes the distinction between maintenance Capex and growth Capex on its reports. So the actual amount of cash the company has generated in 2018 is £29M.
(FCF= Cash from operations – Maintenance Capital Expenditures)
3.8. SEASONALITY
There is high seasonality to The Gym Group sales, the 1st quarter being the strongest one when everyone joins the gym after the holidays. There is also a slight increase in new memberships in September when people go back to their jobs and schools.
3.9. DIVIDENDS
I’m not sure why, but the company pays a small dividend of 1,3p per share.
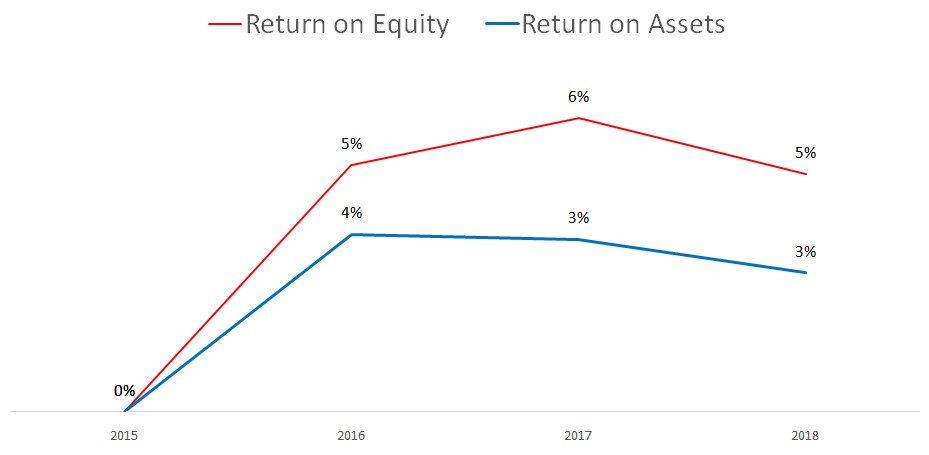
3.10. PROFITABILITY RATIOS
Because the net income is so depressed, the profitability ratios are really low.
3.11. FINANCIAL RATIOS
The Gym Group is a negative working capital business (the members pay upfront and the company defers its payables into the future) leading to a current ratio below 1 and as we can see, the company has been able to maintain its debt-to-equity ratio at a very sound level of 0,3.
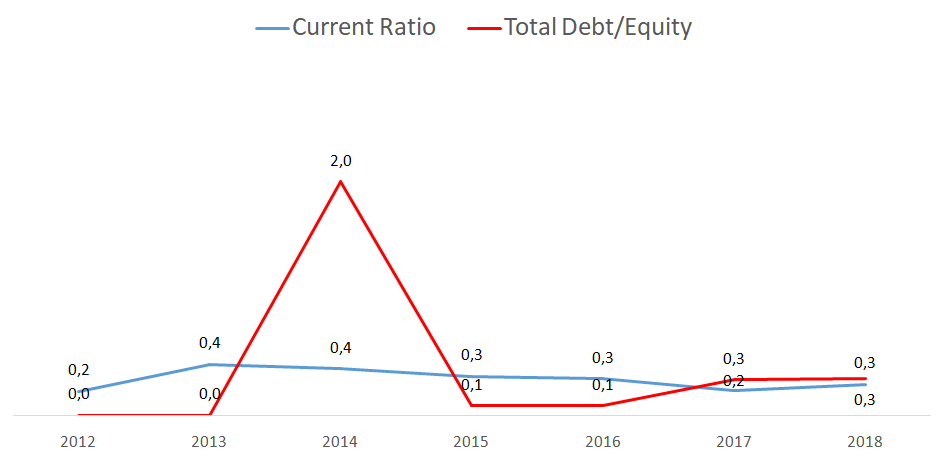
As you might know already, I’m not a big fan of the Debt-to-Equity ratio so I’m looking at the Net Debt/Ebitda ratio just to stay on the safe side.
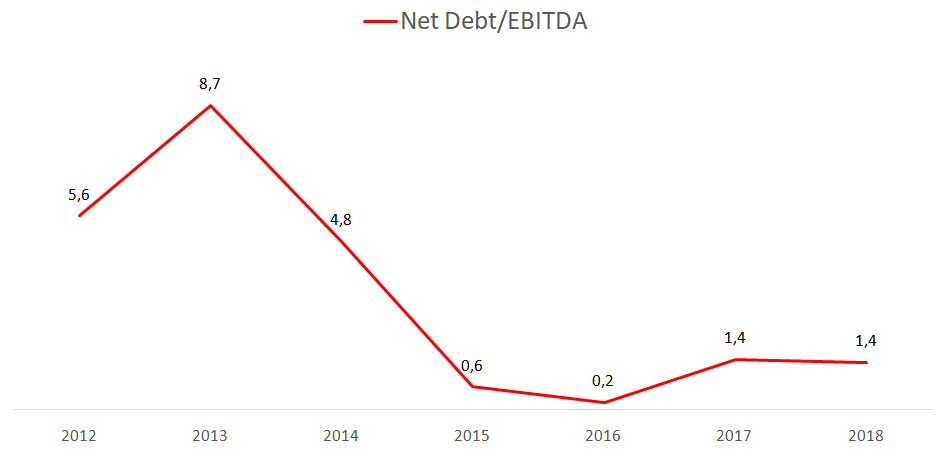
At 1.4, the company has been able to keep Net Debt/EBITDA well under control.
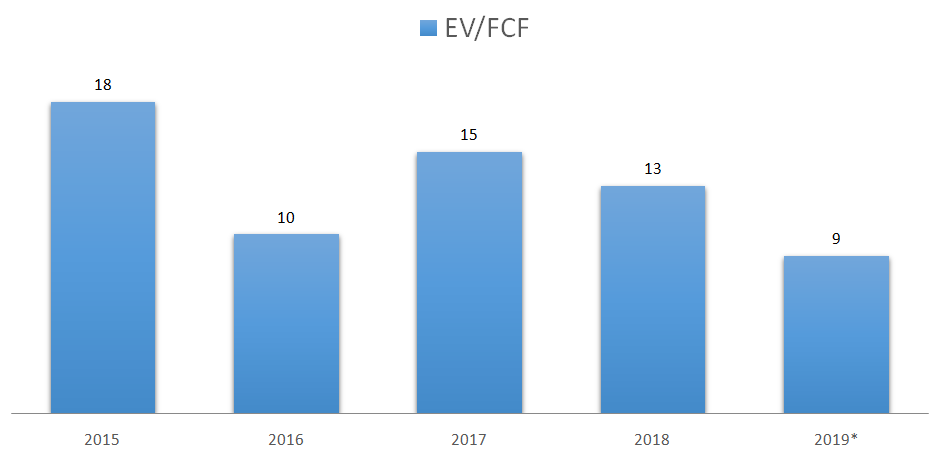
3.12. PRICE RATIOS
Because of what I’ve explained earlier, one of the key ratios we should be looking at here is the EV-to-FCF and that ratio is currently 9, which is, however you’d like to look at it, a really low valuation, especially for a company growing at 27% per year.
I’m using the Enterprise Value (Market Cap + Net debt) because I will compare The Gym to its competitors with higher debt so this way we’ll be comparing apples to apples.
4. GAINING PERSPECTIVE
4.1. INDUSTRY AND STRATEGY
The low-cost gym industry is flourishing all across Europe. A recent study by PWC indicates that in the UK alone, it could double to 1200/1400 sites in 2026. Being the second largest operator, The Gym Group is well positioned to take advantage of this tailwind.
Last year alone, they’ve opened 17 new Gyms and acquired 13 gyms from EasyGym for £20,5M. In 2017 they’ve opened 21 new gyms and acquired 18 from LifeStyle for £20,6M
Just like PureGym, this year they are opening their first small box format and they will start a rollout thereafter.
In 2018 there was a major change to the company’s business model after complaints that it had Personal Trainers working for the company while not being formally employed by it. Historically, the personal trainers were able to rent the facilities from The Joint and gave their classes at The Gym locations.
Because of the criticism, they are now introducing a new operating model where they hire these PT’s for 12 hours per week and for the rest of the time, the PT’s can use the gym’s on a self-employed basis paying a lower fee than before. Although one might argue that the company was acting in ill faith before, I like to see that they’ve corrected their behaviour in a timely manner.
4.2. RISKS AND COMPETITION
Because their whole business model is based on being the cheapest gym in the market, if its competitors lower their prices, The Gym will have to do the same.
Because this is a business with high operating leverage, if their fixed costs go up (rent, overhead, etc) margins will be affected in a meaningful way.
I would argue that a recession is a false risk because that’s when they’ll take new clients away from their more expensive competitors.
There are some construction works on the company’s gyms that are done by Closewall Limited, a company who belongs to the ex-CEO’s family, but this is well documented.
4.3. TYPE OF PLAY
The Gym Group is definitely a growth company.
5. OVERVIEW AND CONCLUSION
5.1. OVERVIEW
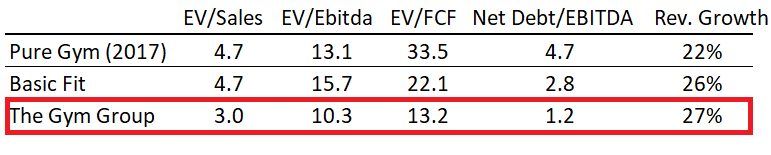
Before we go any further, let’s take a second to compare The Gym’s valuation to its most relevant competitors.
With 218 gyms, Pure Gym is the UK’s largest low-cost gym company. It was acquired for £600M by a Private Equity firm in 2017 but fortunately they still release their annual report.
The Dutch company Basic Fit is the low-cost leader in Europe with 629 gyms.
Comparatively to its peers, The Gym is undervalued by any measure, not to mention the enormous amounts of debt Pure Gym has on its balance sheet, hence the EV comparison.
So now it’s time to make some conservative estimates. These are the assumptions behind my calculations:
- 15 new gyms per year and no acquisitions. The historical average for organic openings per year is 17 and the 2019 guidance is 15 to 20 organic openings.
- £440.000 EBITDA per mature gym (>24 months), decreasing to £400.000 in 2023 because the company is opening smaller gyms.
- Negative EBITDA of -£46.000 per immature gym (<24 months)
- No share dilution because the company will be generating enough cash to open those 15 gyms.
- Growth Capex is £1,4M for each new gym.
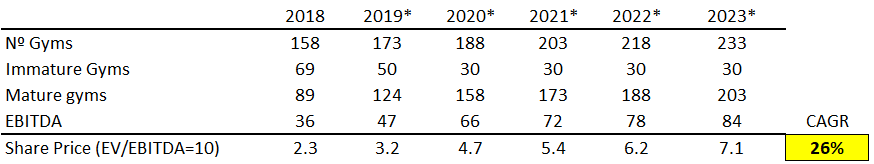
If we apply last year’s conservative multiple of 10x EBITDA, we get to a CAGR of 26% at the end of 5 years. That’s an amazing return.
And now let’s see what would the expected return be if we looked at the FCF instead:
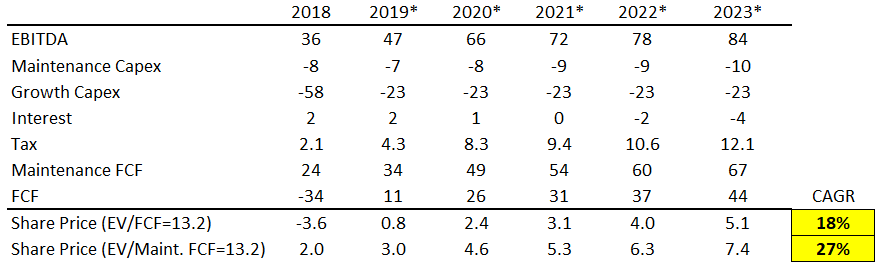
* For the year 2018 there are slight differences between the FCF stated above and the actual figures presented by the company because of the changes in working capital that usually benefit FCF. I’ve decided not to include them in my calculations, leading to a lower and thus more conservative FCF value.
Note that I’ve even calculated the FCF WITH growth Capex and it still leads to an 18% CAGR for the next 5 years.
I’m not sure where Mr. Market’s head is at but he is completely mispricing The Gym Group and we have to thank him for that. Depending on the acquisition targets for the next couple of years, I estimate that the company will be generating positive FCF soon and that is when Mr. Market will value this company as he should. In the meantime, thank you Mr. Market! At this valuation, let’s just hope that The Gym Group doesn’t get acquired before it can show its true potential.
Note: I would like to end this analysis by thanking Adrián Hernández and Álvaro Faraco for their precious insights about this business.
5.2. CONCLUSION
This section will be available to paying subscribers in 2019 when we launch the Portfolios. If you’d like to get early-bird conditions, please send us an e-mail.
Don’t forget to check our other analyses. If you want more, join us at our new Facebook group.
6. DISCLAIMER
The material contained on this web-page is intended for informational purposes only and is neither an offer nor a recommendation to buy or sell any security. We disclaim any liability for loss, damage, cost or other expense which you might incur as a result of any information provided on this website. Always consult with a registered investment advisor or licensed stockbroker before investing. Please read All in Stock full Disclaimer.