MTY Food Group,
a fundamental analysis!
March 20, 2019
SHARE PRICE: $57,3 CAD
MARKET CAP: $1,44B CAD
1. INTRODUCTION
MTY Food Group has been one of my highest conviction stocks ever since I started investing. This conviction comes not so much because of a stratosferic expected return but because of the potential for a good upside with limited downside. Although I know this company well, I’ve never actually put anything down to writing so I’ll start by taking a look at its website.
2. BUSINESS OVERVIEW
2.1. COMPANY PRESENTATION
MTY Food Group is a quick service and casual dining franchisor with restaurants in Canada and the USA. It currently has around 6000 restaurants and more than 70 concepts.
The first restaurant that Stanley Ma, the founder of the company, opened was a Tiki Ming back in 1984. There were several predecessors to MTY, (you can read all about it here) and when in 2003 its computer and technology division named Gold Tech Computer Systems was spun-off, the company renamed itself MTY Food Group, becoming entirely dedicated to the restaurant and food industry.
As most of the restaurant franchisors out there, the company makes money in more than one way. Here are the most important:
a royalty fee on all franchisee gross sales that can go from 4,5% to 7%.
between 1% and 4% of the franchisee gross sales as a marketing fee.
an initial franchise fee that ranges from $25.000 to $50.000.
Renewal fees ranging from $1.000 to $5.000 per renewed year.
The company also profits from the sale of goods and supplies to its franchisees.
MTY is a roll up, which means it grows through acquisitions of smaller restaurant chains. This is a growth strategy which the company has been following with great success for many years and one that doesn’t sit well with our friend Mr. Market. He tends to sell roll ups at a discount from their peers.
MTY’s brands were usually small unrecognizable ones, but as the company grows larger it has to buy larger companies which usually own more recognizable brands.
Among all of these brands, there is one that immediately grabs my attention which is Tasti-di-Lite. This is the company of which Peter D Holt was in charge of before becoming The Joint’s CEO, a company I’ve recently analyzed. What a small world.
2.2. LARGEST SHAREHOLDERS
This is where it starts to get interesting. Stanley Ma is already a bit of a living legend among the value investing community. Until last year he was the CEO. He is a low profile, frugal owner operator with an eye for acquisitions. He is the exact kind of CEO that I’m trying to find when looking for companies to invest in.
Here is a good article on Stanley Ma if you want to know his story better.
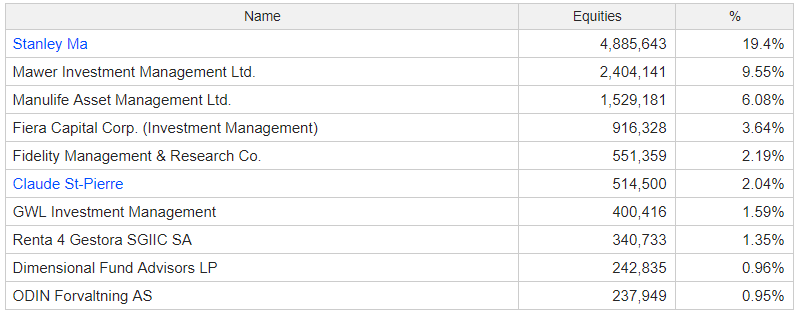
I can also recognize Renta 4. It’s the home for the spanish fund True Value, where Alejandro Estebaranz and José Luis Benito work their magic. It was thanks to them that I’ve found MTY. Thanks guys.
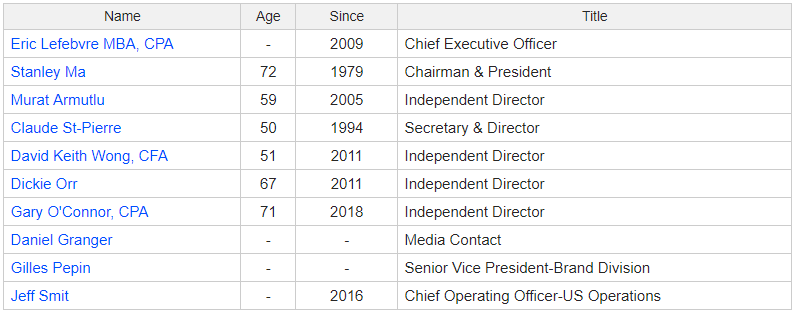
2.3. MANAGEMENT TEAM
Eric Lefebvre was the CFO until the stepping down of Stanley Ma last year. He has been in the company for years so he shares its culture too.
3. HISTORICAL CONTEXT
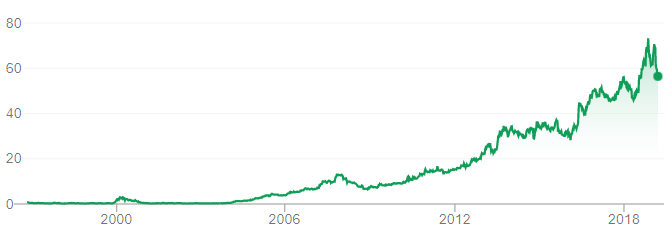
3.1. LONG TERM CHART
And this chart my friends belongs to a 312 bagger company. That means that the stock price has multiplied by 312 times from its lowest to the current $57,30CAD.
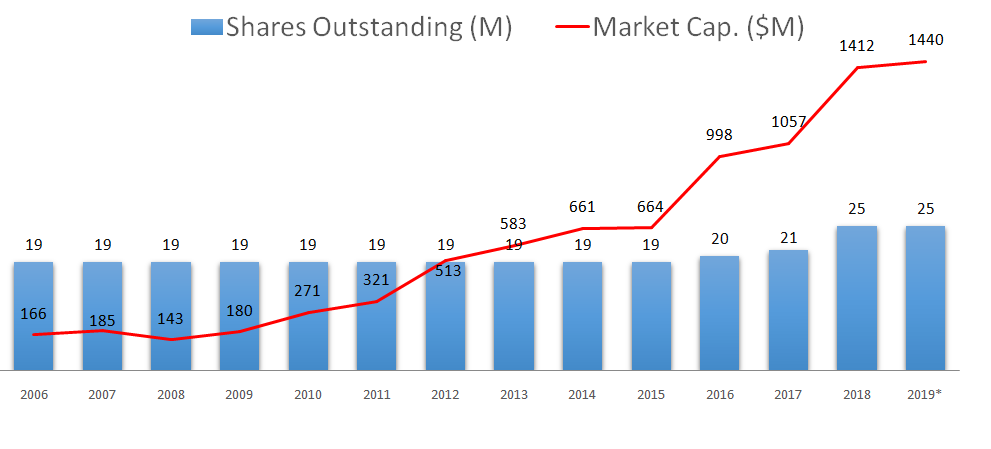
3.2. MARKET CAP AND SHARES OUTSTANDING
The number of shares outstanding has remained relatively stable until 2016 when management decided to issue shares in order to make larger acquisitions. The same happened in 2018.
At the current share price of $57,3, the Market Cap is $1,44B CAD.
3.3. SALES - OPERATING INCOME - OPERATING MARGIN
Unfortunately I don’t have data going further back than 2007 but I think this is enough for us to get the point. Since then, sales have been growing at a 25% CAGR, having reached $353M in 2018.
MTY is a very defensive and somewhat countercyclical company. In the middle of the greatest financial crisis in decades, it was able to grow both its revenue and profit. In fact, in 2009 alone, its revenue grew 52%.
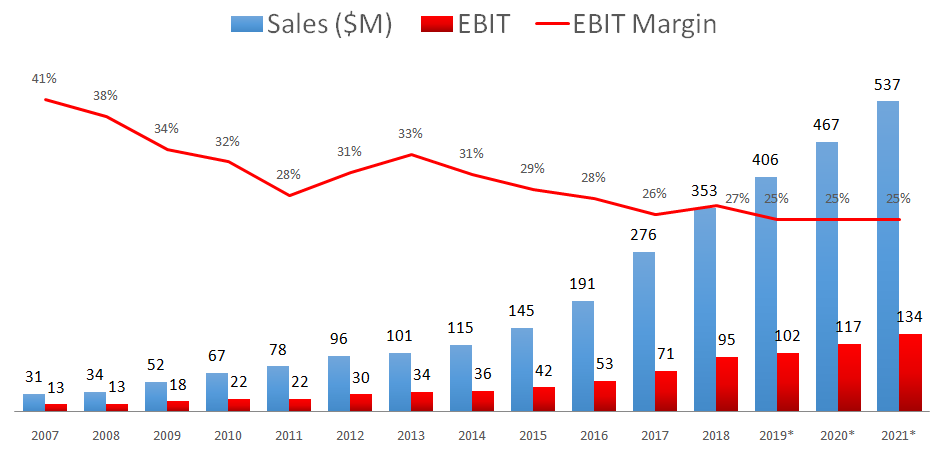
Something which I obviously don’t like to see is the decreasing operating margin.
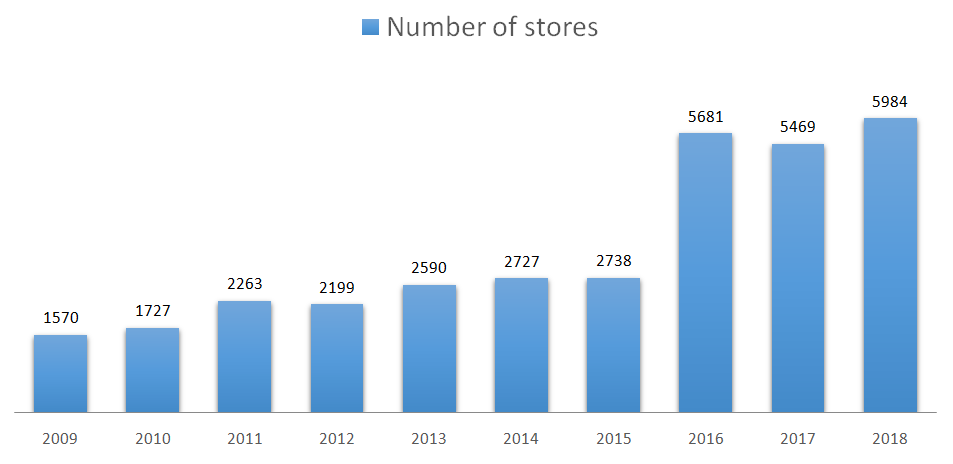
3.4. STORE COUNT
Back in 2016 the company made its largest acquisition to date. It bought Kahala Brands for $310M USD and it got 2800 new international stores in return.
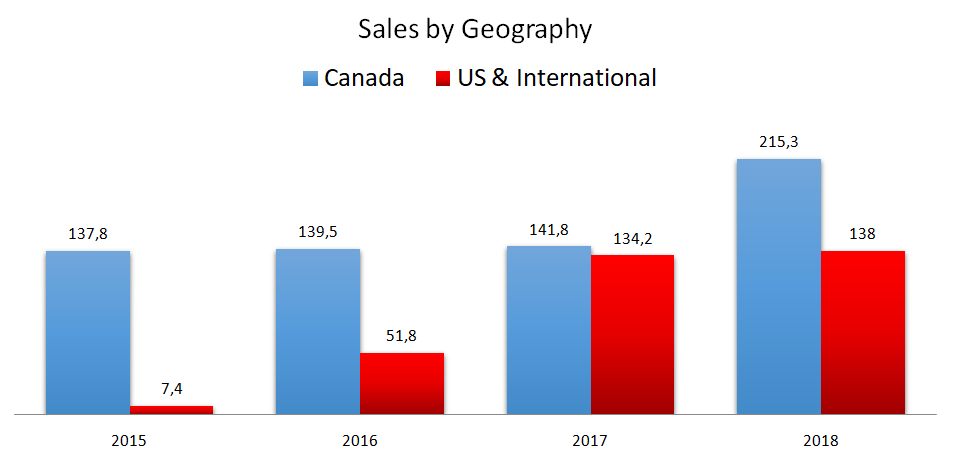
3.5. SALES BY GEOGRAPHY
That is why the sales distribution has changed so dramatically in 2017. At the time of the acquisition, Stanley Ma said that MTY had now “a solid, profitable and scalable platform from which to grow its US and international operations.”
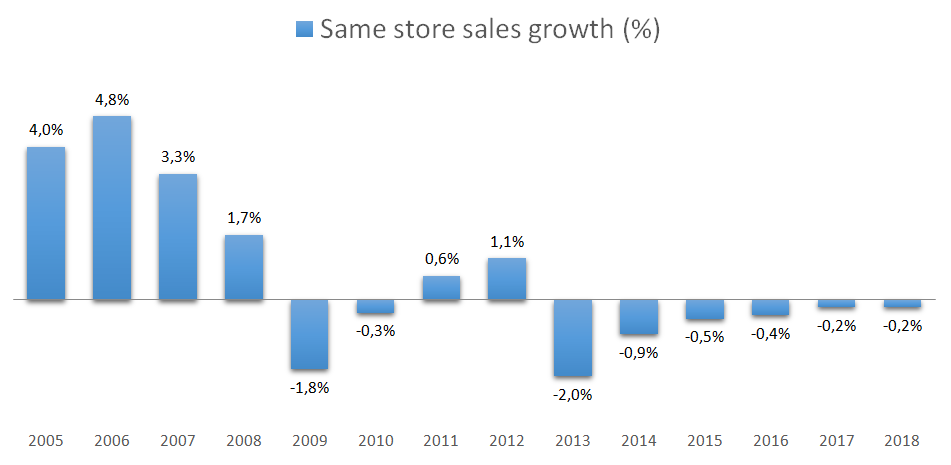
3.6. COMPARABLE SALES
Unfortunately for the past 6 years the SSS growth has been negative. Although there is no running away from this fact, one could argue that at least the company has been able to reduce this negative growth and, from a purely geometric perspective, it seems that sooner or later it will report positive SSS growth.
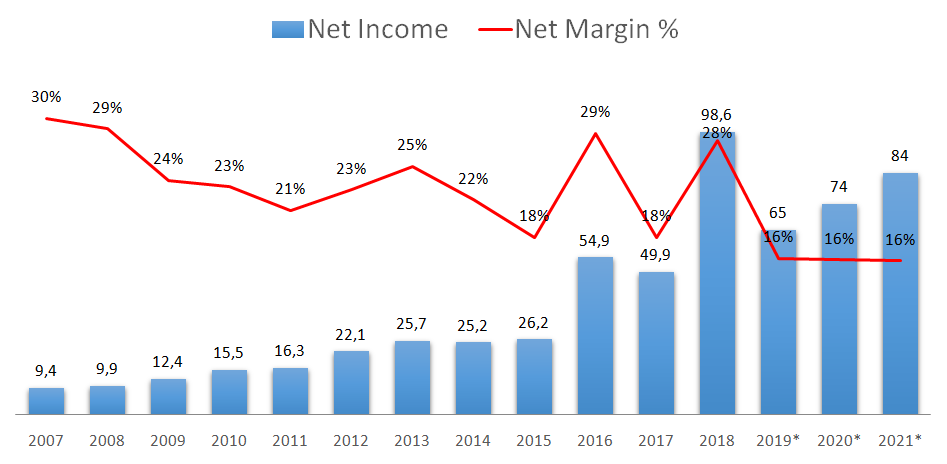
3.7. NET INCOME, NET MARGIN
Net income for 2018 was $98.6M due to a non-recurring adjustment on the US income tax rate. If it wasn’t for this adjustment, net income would’ve reached $63M, representing a 18% net margin.
3.8. CASH FLOW
Because of all the amortization expenses that are stated on the P&L, a better measure for the company’s ability to generate cash is the FCF.
As we can see, in order to keep this business running, there is almost no need for investment. Although it isn’t stated on the chart, the proceeds from the selling of stores usually makes Capex negative. And this is why the FCF is frequently higher than the Net Income.
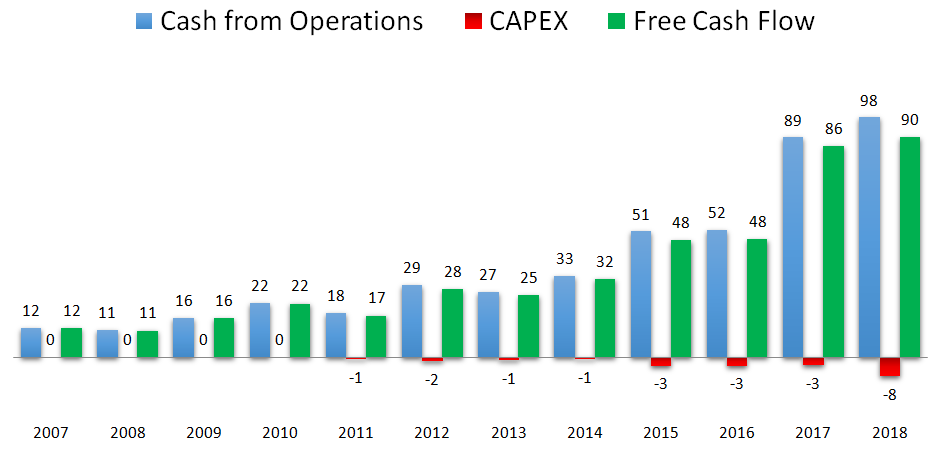
As we can see, the acquisition of Kahala Brands gave a huge boost to the company’s FCF in 2017.
3.9. SEASONALITY
There is some seasonality to MTY sales, especially after buying Kahala brands and the ice cream and frozen yogurts businesses. The 2nd and 3rd quarter are the best performing ones.
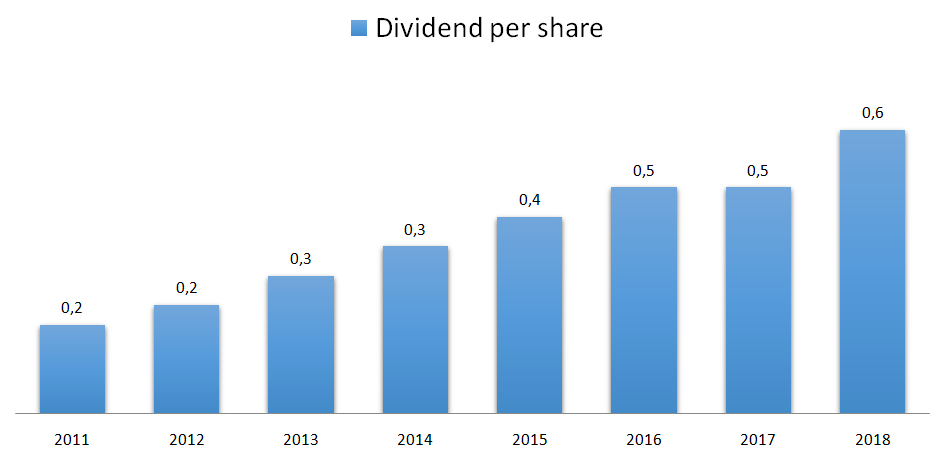
3.10. DIVIDENDS
Dividend per share has been increasing throughout the years having reached $0,6 in 2018 which represents a 1% dividend yield.
If we take a closer look, we can see that in 2017 the company halted the dividend growth in order to pay down debt, as we’ll see in a minute. That’s some good capital allocation right there.
3.11. PROFITABILITY RATIOS
Unfortunately both the ROE and the ROA long term trajectories aren’t what I would expect. It seems that as time goes by, the company is less profitable in relation to its equity and assets.
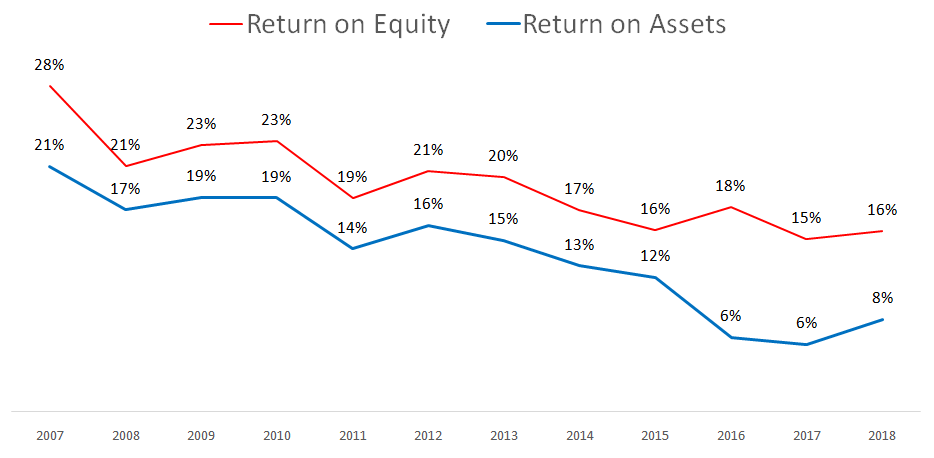
But there is a different way to look at it.
If we assume that the difference in FCF generated annually by the company between 2008 and 2018 was $79M, and that the company has invested $425M in acquisitions for that period, we get a 18,5% Return on Invested Capital, which goes to show the ability that this management has to buy and integrate new businesses at great prices.
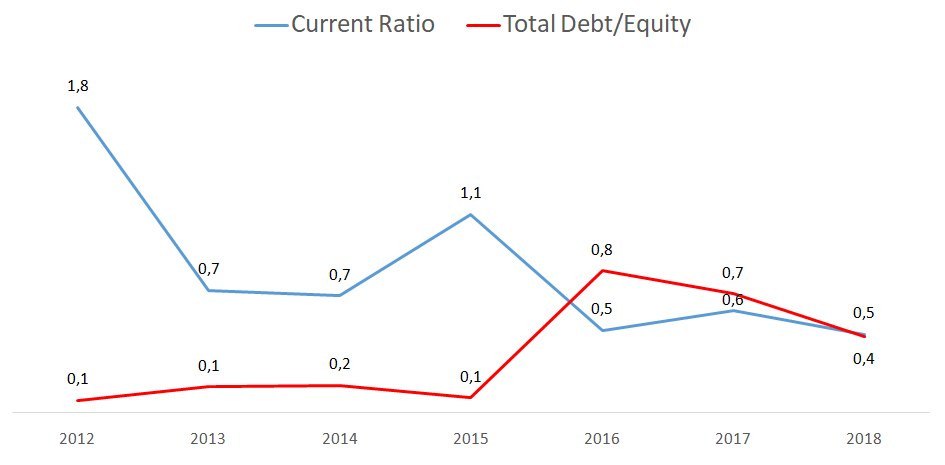
3.12. FINANCIAL RATIOS
The company’s current ratio is 0,5 indicating that this is a negative working capital business.
And in addition to the equity raise we’ve seen back in 2016, the company also raised debt in order to finance the Kahala Brands acquisition. Its debt-to-equity ratio went to 0.8, but right afterwards, the company used the available cash flow to pay down the debt.
But what about the Net Debt/EBITDA ratio?
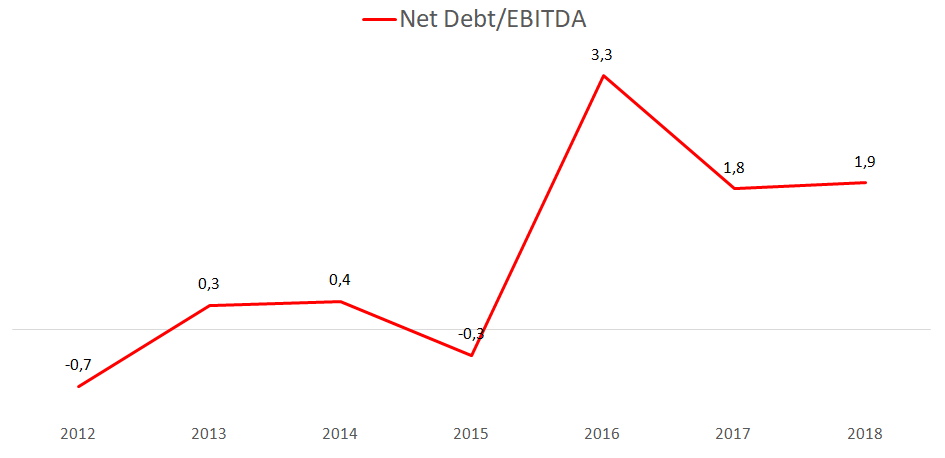
This ratio is now at 1,9 which for a defensive and predictable business like MTY, is perfectly sound. In fact, because of its debt covenants, MTY has to maintain its Net Debt/EBITDA ratio under 3.
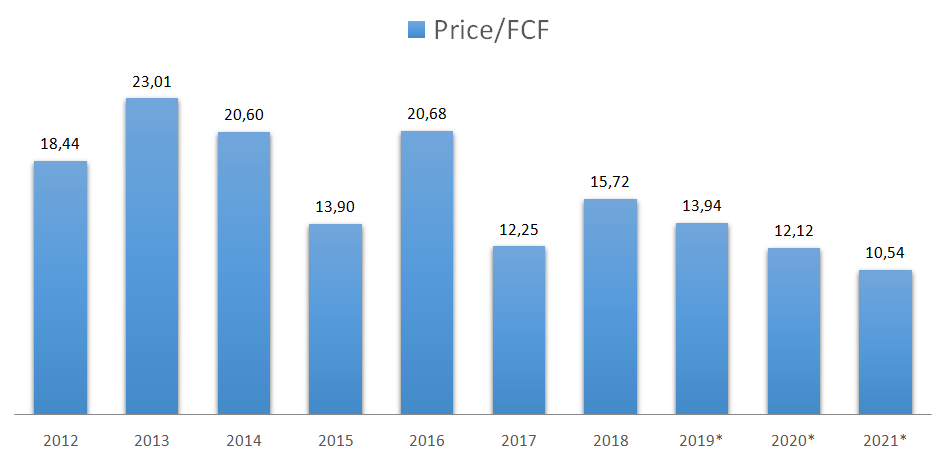
3.13. PRICE RATIOS
Like I’ve said before, the big amortization expenses are masking all the cash that the company is making, so the best metric here is the Price-to-FCF ratio.
The company is now trading at a 2019 P/FCF of 14 and its historical P/FCF has been 16,3.
4. GAINING PERSPECTIVE
4.1. INDUSTRY AND STRATEGY
As stated on my previous analyses to McDonald’s and Yum Brands, the quick service business is a very tough one to be in right now. We’ve been seeing increasing competition from all sides: Supermarkets, small restaurants, delivery apps, you name it.
As scale is an important factor to gain brand recognition, bargaining power with suppliers and landlords, and the possibility to raise more debt, the company has been stepping its game up with larger acquisitions like the Kahala Brands and new markets like the casual dining segment through the acquisition of Invescor in 2018.
4.2. RISKS AND COMPETITION
Given the fact that the basic pillars of growth for MTY are the acquisitions of other companies, one of the major risks lies on its biggest strength. The ability to acquire good companies and be able to integrate them successfully. The company needs to keep making acquisitions in order to keep growing, and as it becomes larger and larger, these acquisitions will be fewer and at higher multiples.
At first, an economic slowdown might appear as a risk, but we’ve seen that the company has been able not only to resist a big crisis but to thrive in it. If a big crisis comes knocking at its door, it will be the perfect time to grow by acquiring other cheap companies.
The fact that it has increased its debt could potentially keep it from making large acquisitions, which would then have to be funded by stock issuance, dillutting the existing shareholders stake.
4.3. TYPE OF PLAY
MTY Food Group is definitely a growth company.
5. OVERVIEW AND CONCLUSION
5.1. OVERVIEW
MTY food is one of those companies every investor dreams of finding early.
As Chris Mayer wrote on his book “100 Baggers“, the perfect time to have bought MTY was back in 2003 when, in the aftermath of the dotcom bubble, MTY’s IT business was hiding a profitable franchising business. MTY was trading at a PE of just 3,5.
And what can a growing EPS together with a multiple expansion do to a stock?
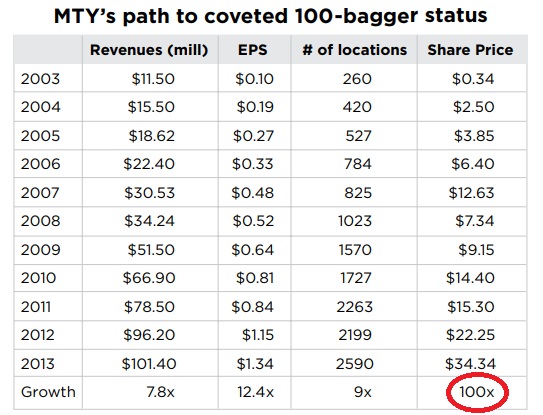
It can turn it into a 100 bagger!
So a good exercise I like to do at this stage when it comes to companies with predictable cash-flows, is to imagine a doomsday scenario where the company stops growing tomorrow. If this were to happen, where would the stock be in 5 years time?
With the money the company generates every year (starting at $90M FCF), it could cut down its debt to zero in just two years. By doing this, it would stop paying interests, leading to a higher FCF, and on top of it, the company would instead collect interests since it would have net cash in the bank.
This way it would reach 2023 making around $134M in FCF. At the historical P/FCF of 16.3, this would lead to a $2B market cap. If we add the $327M it would have accumulated in net cash, this would lead to a $2.3B valuation which is the same as a $88,6 share price (assuming no change in the number of shares outstanding). This would represent a 9,2% CAGR….. for a no growth company.
So why can we buy such an amazing company at such a good price?
Because this is a roll up, because there wasn’t a really well known brand among the more than 70 concepts the company owns, because the same store sales are usually slightly negative and mostly because the company doesn’t pay a meaningful dividend like its competitors in Canada (KEG Royalties, Boston Pizza Royalties, etc) that have a 100% payout ratio but no growth at all, although it could. Because of all these reasons, Mr. Market isn’t that much of a fan of MTY and he offers it to us at a very reasonable price.
But as we’ve seen, our friend Mr Market is wrong. MTY Food Group has been a great business for years, it has an amazing management team, it’s generating more cash than ever and most important of all, it still has a long runway in front of it.
Even in a doomsday scenario like the one I’ve presented on my back-of-the-napkin calculation above, shareholders would be just fine owning this stock for the long run.
5.2. CONCLUSION
This section will be available to paying subscribers in 2019 when we launch the Portfolios. If you’d like to get early-bird conditions, please send us an e-mail.
Don’t forget to check our other analyses. If you want more, join us at our new Facebook group.
6. DISCLAIMER
The material contained on this web-page is intended for informational purposes only and is neither an offer nor a recommendation to buy or sell any security. We disclaim any liability for loss, damage, cost or other expense which you might incur as a result of any information provided on this website. Always consult with a registered investment advisor or licensed stockbroker before investing. Please read All in Stock full Disclaimer.