Redishred
2020 Q2 results
By Manuel Maurício
August 28, 2020
Redishred
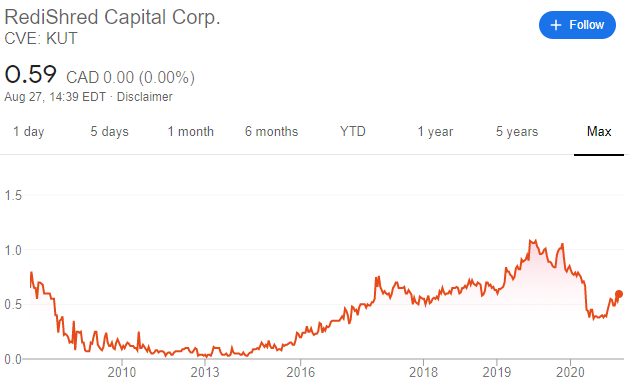
(KUT: CAD$0.59)
I was waiting for Redishred’s results to come out this week before I made a decision on whether or not I would be adding it to the Portfolio.
Usually, the second quarter is the strongest for Redishred. This is due in great part to the accounting firms that close their clients’ books at this time of the year.
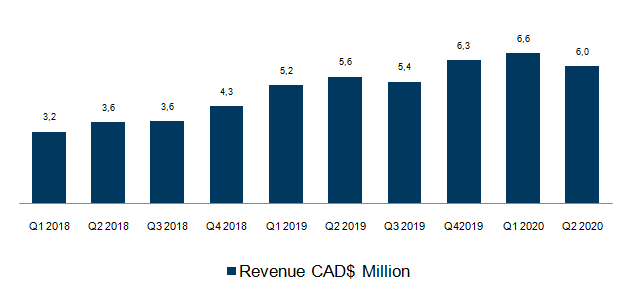
But this year the lockdown changed the picture. The company had $6 Million in sales, down 9% from the first quarter. Not bad at all, considering that most businesses went into work-from-home mode.
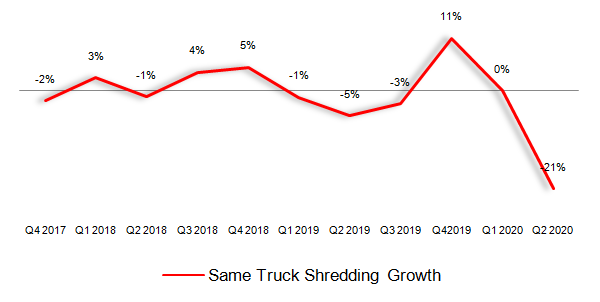
SAME STORE SALES
But the revenue can grow for a lot of reasons (i.e. acquisitions, paper price rising) so what we should be looking at is the Same Location Shredding growth (SSS). This way the paper price volatility and the recent acquisitions don’t mess around with our view of the business.
As expected, this growth was down by a lot, -25%. The company had already mentioned that in April the SSS were down -40%, so -25% for the quarter doesn’t seem all that bad.
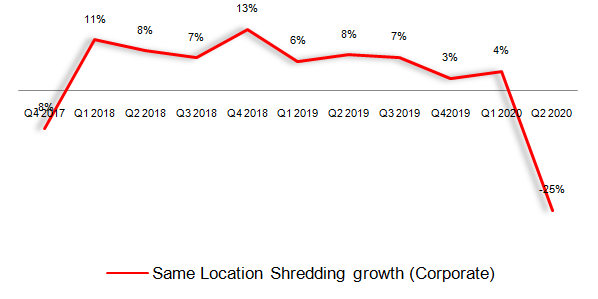
This time around, the company gave us a little bit more colour on the SSS growth breakdown by month. April was obviously the worst, then May was similar and July was much better. The CEO hinted on the earnings call that in August it was pretty much flat, so I’m not really sure if he was comparing it to July 2019 or to July 2020. I believe he was referring to the last year.

But, the SSS might be deceiving as well. The company just needs to buy a new truck for a location that previously had one truck and the SSS for that location suddenly doubles. And I suspect that that’s what’s happening here.
The company doesn’t disclose how many trucks it owns so I came up with my own way to figure it out. The company states the aggregate cost of all the trucks it owns. I’ve Googled “shredding truck prices”, and although I’ve only been able to find used truck prices, I believe that a reasonable price for a new truck might be around US$200K (CAD$262K).
If we divide the aggregate cost given by the company by the cost of each truck, we’ll get an approximate number of trucks. If we then divide that number of trucks by each location we’ll get the number of trucks per location. I’m not looking for the exact number of trucks per location given that the price of each truck was just an educated guess. What I’m looking for is the trend. Has the number of trucks per location been growing or shrinking?
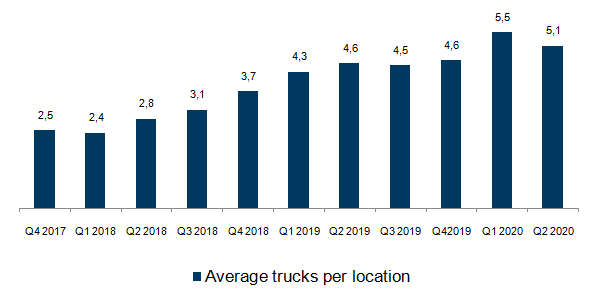
And here it is. The number of trucks per location has more than doubled over the past 10 quarters. Again, this might not be bad at all. It might mean that there is enough demand to pack each location with more trucks. But it also leads me to believe that the SSS growth must be taken with a grain of salt.
While the company is packing its locations with more and more trucks, it’s also increasing its costs more than its increasing its revenue. That has led to a lowering gross margin over the past 10 quarters.
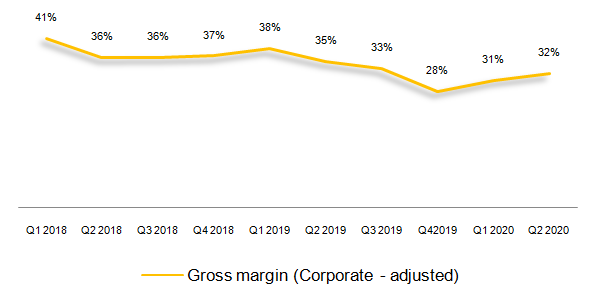
Truth be told, it looks like the trend has been inverted in the most recent quarters, but given the pandemic, I wouldn’t read too much into it. I believe that the reason for the declining gross margin might be that while the company has used more trucks in each location, their routes haven’t matured yet (i.e. each truck isn’t at its maximum capacity).
Either way, now that I have an approximated number of trucks, I’ve come up with a new metric of my own, Same-Truck-Sales growth (STS). I wonder if other investors have derived the same metric for similar companies such as UPS or Waste Management.
If we forget for a minute the past two quarters (those were aberrations), what we see here is that there have been several quarters with negative Same-Truck-Sales growth while the Same-Store-Sales growth have been positive. I have sent an email to the CEO asking about this.
PAPER PRICES
Regarding the paper prices, the past 2 years have been a wild ride to say the least. From the all time highs of about $185/ton in the third quarter of 2018 to the all time lows of $67 in the first quarter of this year, then back up again and down again to $82 in August.
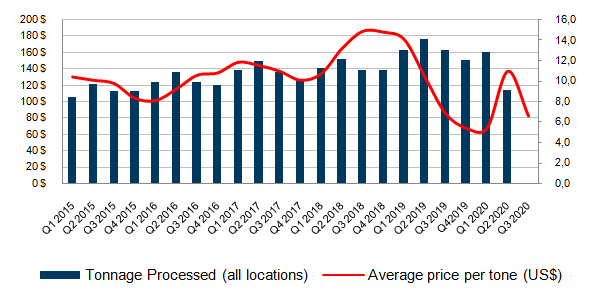
One way for investors to mute the paper price variations when analysing the business and making estimates for the future would be to simply use the 10 year historical average of $135. That’s what the management does in their internal controls.
BALANCE SHEET
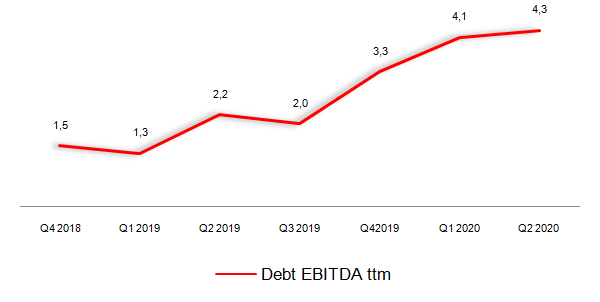
Given the recent debt-fueled acquisitions of the Chicago and Connecticut locations together with the lockdowns, the Debt-to-EBITDA ratio has gone up a lot and it’s currently at 4,3x. I’m not liking this increased debt levels, but I’m also not jumping the boat before I make some estimates of future debt-repayments.
During these times of uncertainty and financial constraint, the company has been able to negotiate a deferral of its debt payments and truck financing for a few months as well as a waiver on its debt covenants for the first 2 quarters (two of the 3 covenants were breached). It helps having few lenders.
At the end of the 2nd quarter, the company had CAD$8,8 Million in cash. It still owes $2 Million to in Contingent Consideration (cash owed to the previous owners of the acquired locations), and $1M must be spent on salaries, so let’s say that the true available cash is $5,8 Million which, together with its remaining credit facilities make up about $9 Million in available liquidity.
CONCLUSION:
During this week, a lot of questions came to my mind and I’ve sent an email to Jeff, the CEO, asking for clarification on 10 different points. He kindly replied that he was going on a brief holiday next week, but that we could talk on the 7th of September. I’m not sure if he’s going to allow me to record the call so I can share it with you, but if he doesn’t, I will post my notes here.
Having said that, I am deferring my conclusion until I talk to Jeff. The truth is I like this company and I’m definitely thinking of adding it to the Portfolio.
DISCLAIMER
The material contained on this web-page is intended for informational purposes only and is neither an offer nor a recommendation to buy or sell any security. We disclaim any liability for loss, damage, cost or other expense which you might incur as a result of any information provided on this website. Always consult with a registered investment advisor or licensed stockbroker before investing. Please read All in Stock full Disclaimer.